What's New
By Colin Twiggs
October 18, 2009 11:00 p.m. ET (2:00 p.m. AET)
This newsletter is subject to Incredible Charts Terms of Use.
Customize Your Newsletter Profile
You can now customize your profile to receive only those newsletters which match your interests. Click the Amend My Profile link at the top or very bottom of your newsletter email.
New Beta Version
A new beta version is available for testing, with a number of new indicators (listed below). Select Help >> Upgrade to Latest Beta Version, from the chart menu, to access the new features.
23 New Indicators
New indicators are only available on the new Beta version at this stage. Technical pages, with indicator formulas, trading signals and examples are accessible from the indicator panel and from the links below:
- Tushar Chande's Aroon Oscillator identifies new trends
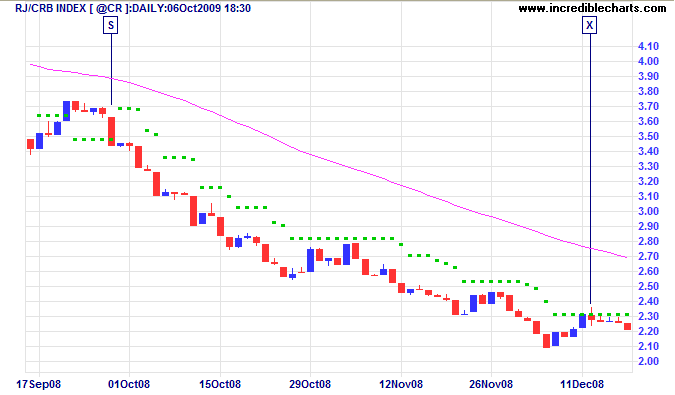
- Average True Range (ATR) Trailing Stops are used to lock in trading profits

- Average True Range (ATR) Bands perform a similar function, but without the stop-and-reverse (SAR) of trailing stops
- John Bollinger's Bollinger %b and Band Width
- Alexander Elder's Chandelier Exits and Safezone trailing stops
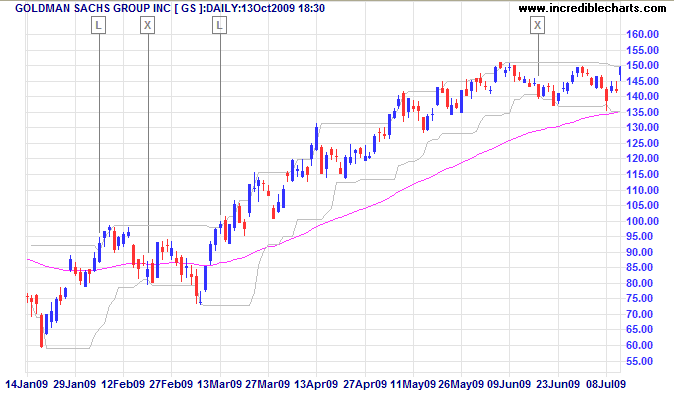
- Richard Donchian's Donchian Channels identify new highs and lows

- Chester Keltner's trend-following Keltner Channels
- Martin Pring's KST Indicator identifies major trend changes
- The Linear Regression Indicator reacts faster than a moving average to trend changes
- Moving Average (Open) — another frequently requested MA variation
- George Topalides' Moving Average Oscillator compares closing price to the moving average
- Percentage Trailing Stops are similar to ATR Trailing stops, but use a straight percentage of closing price rather than average true range
- Price Comparison (Intercept) plots a second stock/index where the user can select a base (intercept) date for comparison
- Price Comparison (Unadjusted) plots a second stock or index without any scale adjustment
- Relative Strength (Intercept) calculates relative strength of a second stock/index according to a selected base (intercept) date
- Welles Wilder's True Range and original Volatility Stops.
Free Subscribers
Free subscribers may notice that some indicators are colored gray in the Indicator panel. These will only be available to premium subscribers after the 30 day free trial period expires.
Some Minor Adjustments
We have made a few minor adjustments to improve ease of use and accessibility of some indicators.
Twiggs Money Flow
- The scale of Twiggs Money Flow has been amended to a percentage scale, similar to the Stochastic and ROC indicators; and
- True Range is calculated from the first day's data rather than the second. This has no impact on current values but simplifies the formula for use in Metastock and other charting software.
Multiple Moving Averages
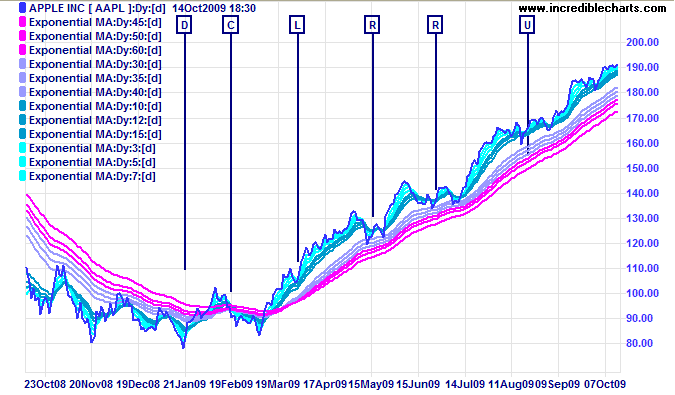
Daryl Guppy's Multiple Moving Averages and Ivan Ballin's colorful Rainbow 3D Moving Averages are now available from the main indicator menu.

Bollinger & Percentage Bands
Bollinger Bands and Percentage Bands (Price Envelopes) now offer upper and lower band settings separately; so they can be set at different distances from the moving average.
Directional Movement
There is now a separate option (No ADX) that offers Directional Movement DM+ and DM- without the ADX line.
Suggestions & Requests
We have expanded our development team and hope to report more frequent improvements to the charts, stock screener and data coverage in future. Thank you for all the suggestions and requests. While not all can be accommodated, the weight of requests guides us in setting development priorities.
Feedback is the breakfast of champions.
~ Kenneth Blanchard.

Author: Colin Twiggs is a former investment banker with almost 40 years of experience in financial markets. He co-founded Incredible Charts and writes the popular Trading Diary and Patient Investor newsletters.
Using a top-down approach, Colin identifies key macro trends in the global economy before evaluating selected opportunities using a combination of fundamental and technical analysis.
Focusing on interest rates and financial market liquidity as primary drivers of the economic cycle, he warned of the 2008/2009 and 2020 bear markets well ahead of actual events.
He founded PVT Capital (AFSL No. 546090) in May 2023, which offers investment strategy and advice to wholesale clients.
