Gold & Silver Rise As Dollar Weakens
By Colin Twiggs
September 8, 2009 2:30 a.m. ET (4:30 p.m. AET)
These extracts from my trading diary are for educational purposes and should not be interpreted as investment or trading advice. Full terms and conditions can be found at Terms of Use.
Apologies for inserting the incorrect link in Monday's market newsletter. Hopefully most of you figured out you could use the link at the top of the page.
US Dollar Index
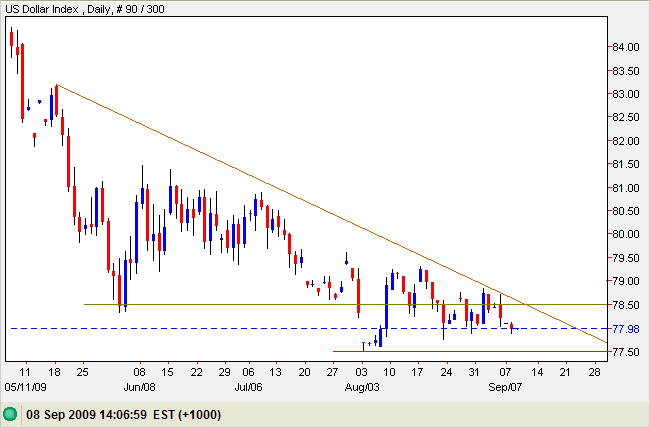
The US Dollar Index is edging lower, testing support at 78 after reversing below the former primary support level of 78.50. Breakout below 77.50 is likely and would signal a down-swing with a target of 74* — placing upward pressure on gold and crude oil prices. Recovery above 79.50, while unlikely, would warn of reversal to a primary up-trend.
Source: Netdania
* Target calculation: 78.5 - ( 83 - 78.5 ) = 74
Gold
Spot gold is consolidating in a narrow band below the key resistance level at $1000 — a bullish sign. The weakening dollar increases the chance of an upward breakout, which would signal an advance to $1100*. Reversal below $970 is less likely, but would warn of another correction to test primary support at $900. In the long term, breakout above $1000 would offer a target of $1300*, while failure of support at $900 would test the November low at $700. The primary determinant of gold direction will be US inflation and consequent stability of the dollar.
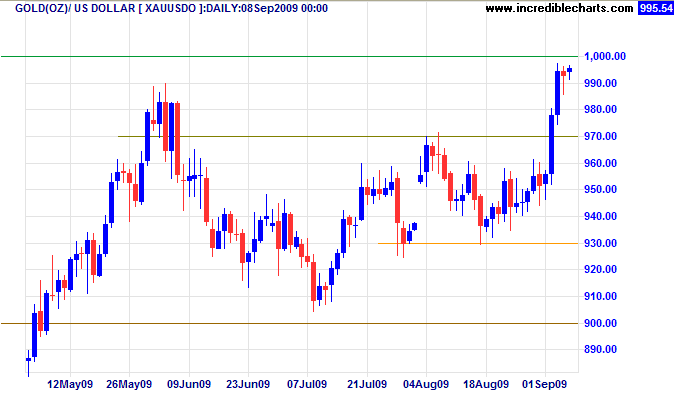
* Target calculations: 1000 + ( 1000 - 900 ) = 1100 and 1000 + ( 1000 - 700 ) = 1300
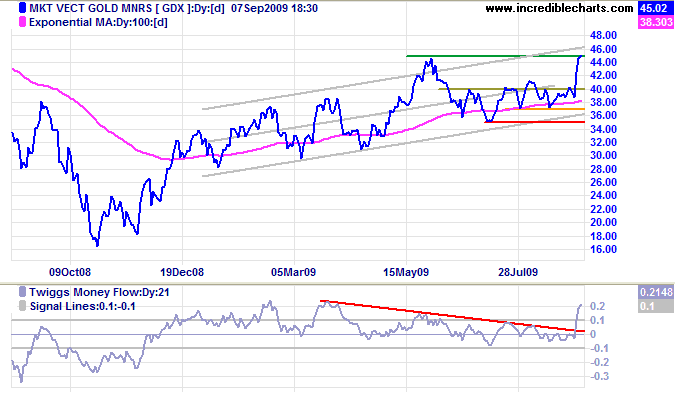
The Market Vectors Gold Miners Index [GDX] is headed for a test of its upper trend channel, on the back of higher spot gold prices. Respect of the channel border, however, would be a bearish sign, warning of another down-swing.
Silver
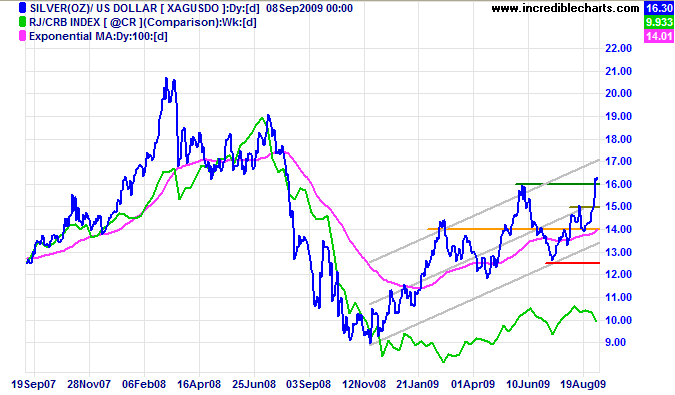
Spot silver broke through resistance at $16, indicating an advance to the upper trend channel — a positive sign for gold. Expect retracement to test the new support level; respect would be a bullish sign for gold, while failure of support would indicate weakness. Reversal below $15 is unlikely, but would warn of a bull trap.
Platinum
Industrial demand exerts greater influence over platinum than over gold prices. The RJ/CRB Commodities Index is undergoing a secondary correction, indicating weaker industrial demand for platinum. Upward breakout from the recent descending triangle, however, is spurred by speculative demand, following the sharp rise in gold and silver. Expect a test of resistance at $1290/1300, but reversal below support at $1220 would warn of a bull trap — and test of $1100. At present breakout above $1300 is unlikely, but would signal an advance to $1500*.
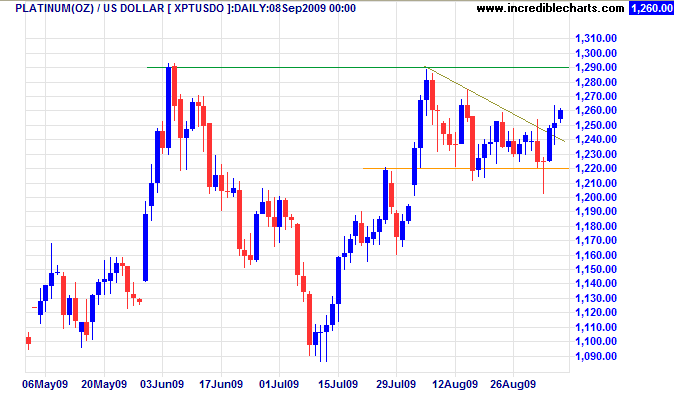
* Target calculation: 1300 + ( 1300 - 1100 ) = 1500
Crude Oil
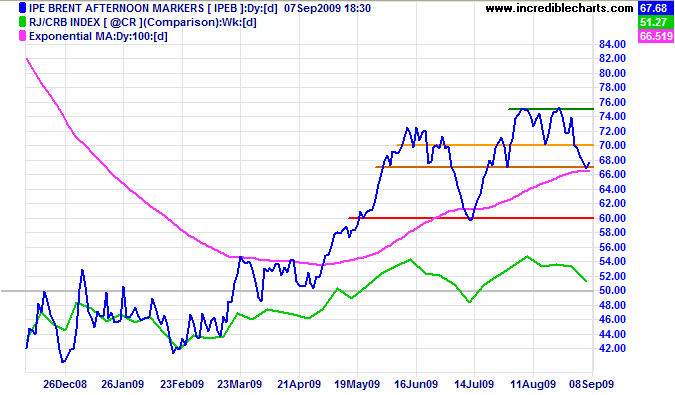
Crude oil broke through support at $70/barrel, warning of a secondary correction in line with the broader RJ/CRB Commodities Index. Retracement that respects the new resistance level (at $70) would confirm the signal — as would failure of short-term support at $67.
Help to keep this newsletter free! Forward this link to friends and colleagues
![]()
By three methods we may learn wisdom: first, by reflection, which is noblest;
second, by imitation, which is easiest; and third, by experience, which is the most bitter.
~ Confucius

Author: Colin Twiggs is a former investment banker with almost 40 years of experience in financial markets. He co-founded Incredible Charts and writes the popular Trading Diary and Patient Investor newsletters.
Using a top-down approach, Colin identifies key macro trends in the global economy before evaluating selected opportunities using a combination of fundamental and technical analysis.
Focusing on interest rates and financial market liquidity as primary drivers of the economic cycle, he warned of the 2008/2009 and 2020 bear markets well ahead of actual events.
He founded PVT Capital (AFSL No. 546090) in May 2023, which offers investment strategy and advice to wholesale clients.
