Secondary Market Support
By Colin Twiggs
March 16, 4:00 a.m. ET (7:00 p.m. AET)
These extracts from my trading diary are for educational purposes and should not be interpreted as investment or trading advice. Full terms and conditions can be found at Terms of Use.
Markets such as Japan, Canada, Australia and India show bullish divergences on long-term Twiggs Money Flow. But all eyes should remain on the elephant in the lifeboat: if the Dow breaks support, most secondary markets will follow.
USA
Dow Jones Industrial Average
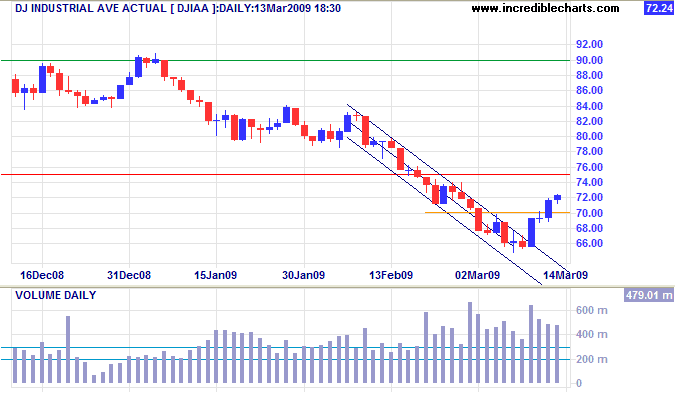
The Dow is headed for a test of new resistance at 7500, but Friday's large volume and narrow range warn of strong short-term selling pressure. The primary trend remains down — with a target of 6000, calculated as 7500 - ( 9000 - 7500 ).
S&P 500
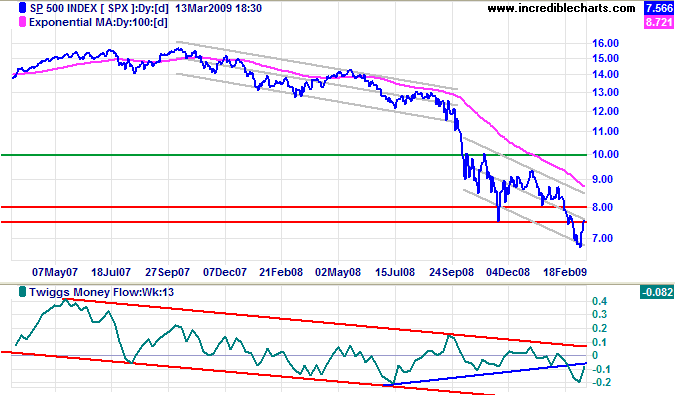
The S&P 500 similarly remains in a primary down-trend, with a target of 600; calculated as
750 - ( 900 - 750 ).
Twiggs Money Flow (13-Week) continuation below the zero line signals long-term selling pressure.
I have taken the unusual step of drawing two separate trend channels on the primary down-trend —
the second commencing after the sharp drop in October 2008.
Wider range on the latest channel indicates increased volatility.
Transport
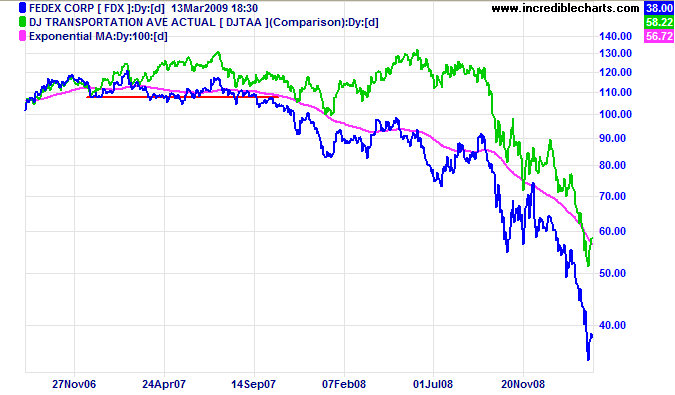
The down-trend of Fedex and the Dow Transport Average show no signs of abating. I often use Fedex as a lead indicator of the broader economy. Its early warning of a primary down-trend in mid-2007, confirmed in September, proved particularly useful.
Canada: TSX
The TSX Composite indicates resillience, with a failed breakout below primary support at 7700 followed by recovery above 8000. Twiggs Money Flow (13-Week) whipsawing around the zero line signals hesitancy, but the indicator displays a bullish divergence and breakout above the upper trend channel would warn of a primary trend reversal. Reversal above 9500 would complete a double-bottom with a target of 11000; calculated as 9500 + ( 9500 - 8000 ). Until then, the primary down-trend remains — with a target of the October 2002 low of 5700.
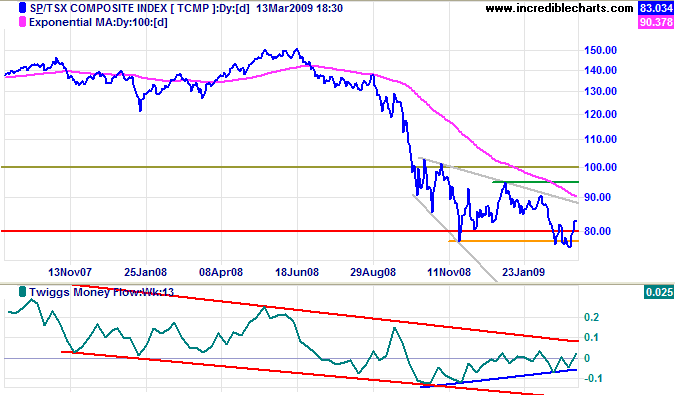
Breakout from the descending broadening wedge (above) would not give a valid signal as the pattern occurs in a down-trend, instead of where it is normally found — as a consolidation during an up-trend.
United Kingdom: FTSE
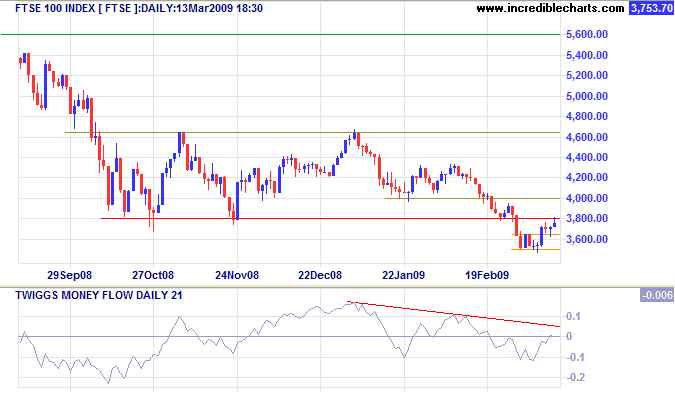
The FTSE 100 encountered selling pressure, indicated by a weak close,
at the new resistance level of 3800.
A descending trendline on Twiggs Money Flow (21-Day) continues to warn of selling pressure.
The primary trend remains down — with a target of 3000, calculated as
3800 - (4600 - 3800).
Only a reversal above the January 2009 high of 4650 could change that. But that is most unlikely.
Europe: DAX
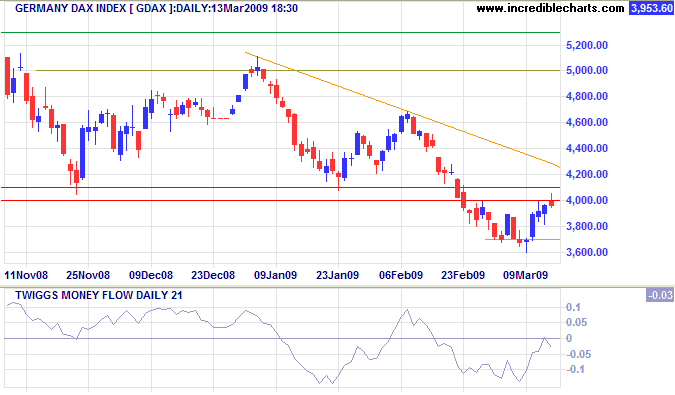
The DAX is similarly encountering resistance at 4000, with
Twiggs Money Flow (21-Day) holding below zero.
The primary trend continues downward — with a target of 3000 calculated as
4000 - (5000 - 4000).
Recovery above 5000 is most unlikely, but would warn of reversal to an up-trend.
India: Sensex
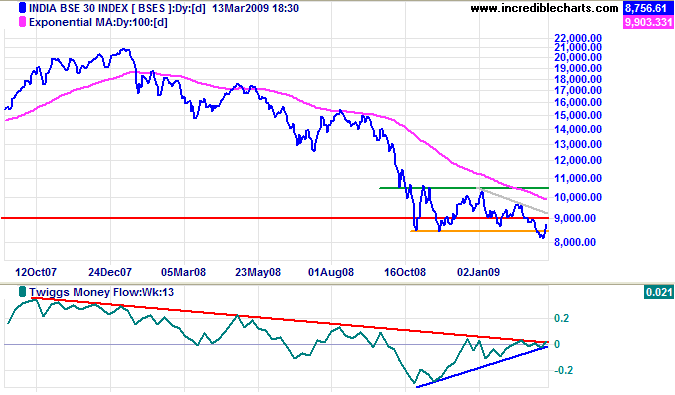
After a failed breakout below 8500, the Sensex is retracing towards medium-term resistance at 9500, but only recovery above primary resistance at 10500 would signal a trend change. Until then, the primary down-trend remains — with a target of 6500, calculated as 8500 - ( 10500 - 8500 ). Twiggs Money Flow (13-Week), however, displays a bullish divergence: clear breakout above zero would warn of a primary trend reversal.
Japan: Nikkei
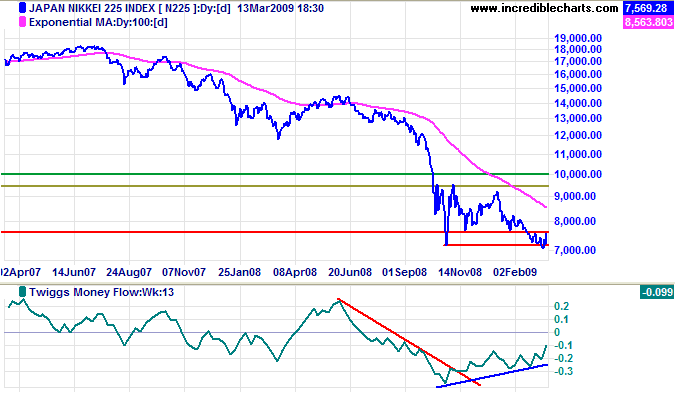
The Nikkei 225, in a similar fashion to the TSX Composite and the Indian Sensex, reversed above primary support — in this case at 7000. Twiggs Money Flow (13-Week) shows a bullish divergence and recovery above the zero line would warn of a primary trend change. Until then, the primary trend remains down. Reversal below 7000 would signal a primary down-swing with a target of 5000; calculated as 7000 - (9000 - 7000).
China
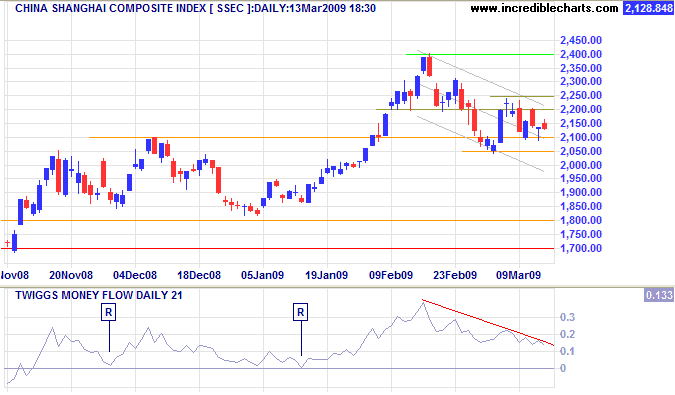
The Shanghai Composite is testing support between 2100 and 2050. Failure would warn of a test of primary support at 1800. Reversal above 2250 on the other hand would signal another primary advance. In the long term, breakout above 2400 would indicate primary (up) trend strength, while a fall below 1800 would signal reversal.
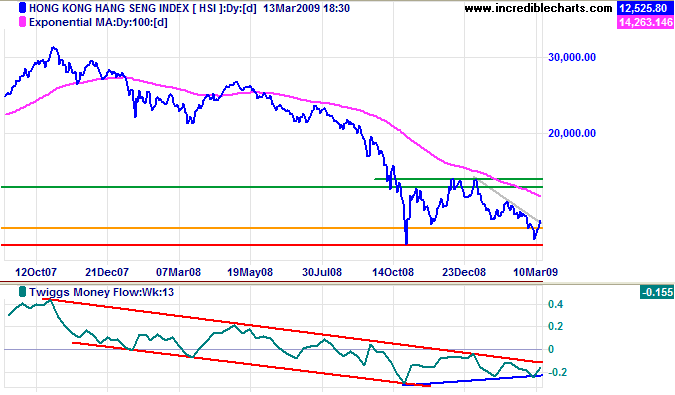
The Hang Seng Index respected primary support at 11000.
Twiggs Money Flow (13-Week) reversal above zero would warn of a trend change.
Recovery above primary resistance at 15600 remains unlikely,
but would complete a double bottom formation with a target of 20000;
calculated as
15500 + ( 15500 - 11000 ).
Until then, the primary trend remains down and breakout below 11000 would offer a target of 8500
— the April 2003 low.
Australia: ASX
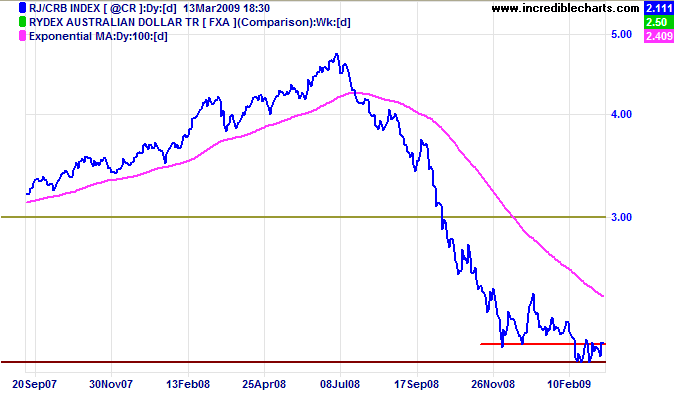
Commodities prices remain low, with the CRB Commodities Index finding support at 200. The primary down-trend is likely to continue — not good news for commodity exporters like Australia.
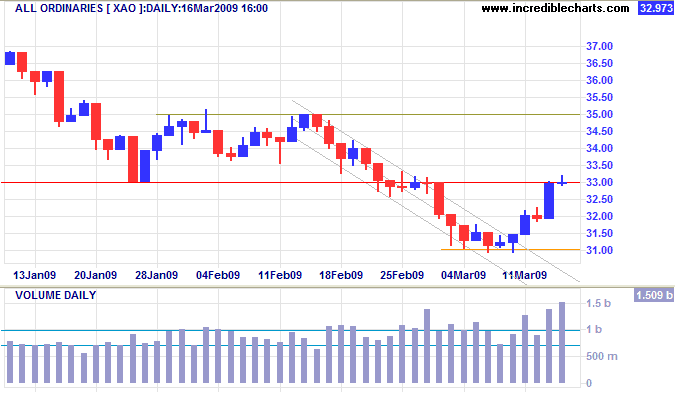
The All Ordinaries is testing the new resistance level at 3300, with large volume and a narrow range indicating strong selling pressure. The primary trend remains down with a target of 2700, the March 2003 low.
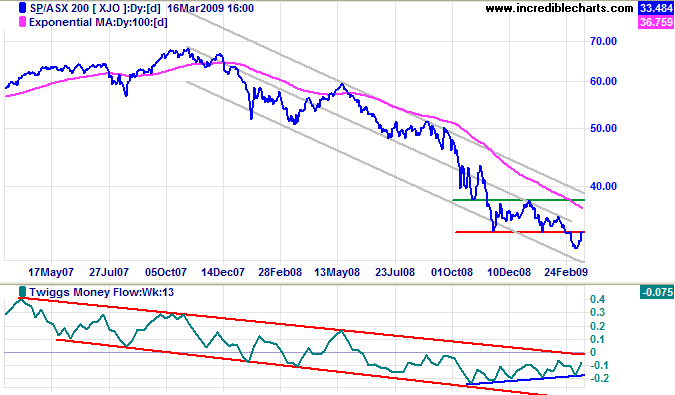
The ASX 200 is likewise testing resistance — at 3350 this time. Twiggs Money Flow (13-Week) shows a bullish divergence, but this would only be confirmed by a breakout above zero. The target for the primary down-trend is identical: the March 2003 low of 2700.
Well now there's a boom in solutions, everyone's got one. Except me.
I've got a prediction: debt will be reduced. It will take a few years, and while that's happening there will be recession and rising unemployment.
Because there's too much global capacity and the money that usually finances its employment will be hoarded.
And those in Sussex this weekend are just 20 spectators.
~ Alan Kohler, discussing the G20 meeting
on
Inside Business.

Author: Colin Twiggs is a former investment banker with almost 40 years of experience in financial markets. He co-founded Incredible Charts and writes the popular Trading Diary and Patient Investor newsletters.
Using a top-down approach, Colin identifies key macro trends in the global economy before evaluating selected opportunities using a combination of fundamental and technical analysis.
Focusing on interest rates and financial market liquidity as primary drivers of the economic cycle, he warned of the 2008/2009 and 2020 bear markets well ahead of actual events.
He founded PVT Capital (AFSL No. 546090) in May 2023, which offers investment strategy and advice to wholesale clients.
