Dow Signal Confirmed
By Colin Twiggs
May 3, 4:00 a.m. ET (6:00 p.m. AET)
These extracts from my trading diary are for educational purposes and should not be interpreted as investment or trading advice. Full terms and conditions can be found at Terms of Use.
Overview
The Dow Industrial Average reversal to a primary up-trend
has now been confirmed by the
S&P 500.
Expect a test of the 2007 highs at 14000.
While the market is recovering, this is more a function of cheap money than a booming economy
— the old maxim still applies: Don't fight the Fed.
Milder than expected employment losses may hint at a soft landing,
but the housing market collapse and resultant credit squeeze are likely to plague the economy for some time.
Banking, housing and other cyclical sectors should be treated with caution.
The FTSE 100 and Nikkei 225 have also confirmed the Dow signal,
while Asia-Pacific markets all look promising.
USA
Dow Jones Industrial Average
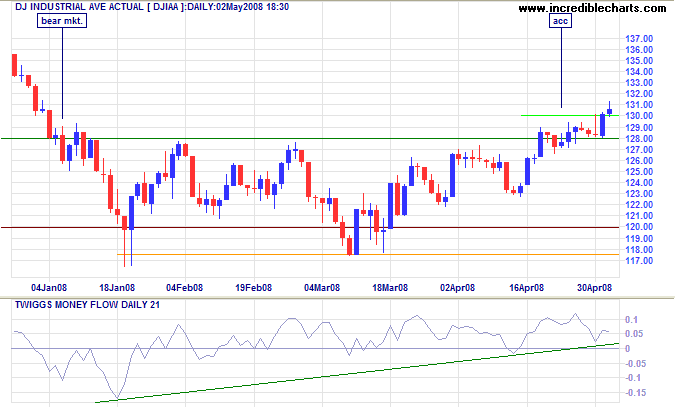
The Dow closed above 13000, confirming the breakout, after a short retracement respected the new support level at 12800 — signaling buying pressure. Twiggs Money Flow holding above zero confirms the buying pressure signal. Reversal below 12800 is now unlikely and would warn of another test of 12000/11750.
Long Term:
Dow purists may disagree (the January reaction only lasted 8 days but retraced roughly half of the previous decline)
but the breakout should be treated as a reversal of the primary trend.
The signal has now been confirmed by the
S&P 500.
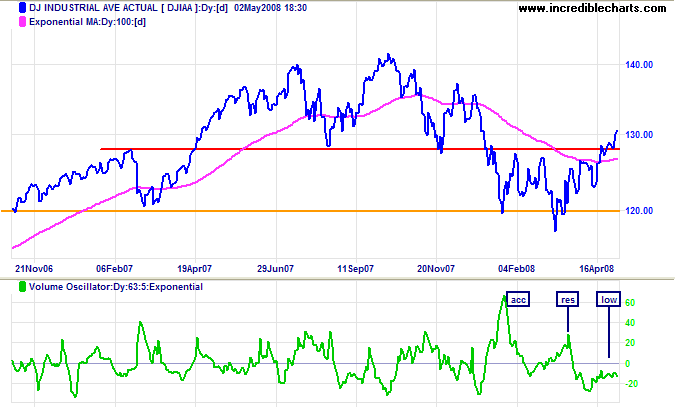
The Volume Oscillator (63,5)
highlights unusual activity levels.
A large spike in January shows strong support at 12000.
The March spike, on the other hand, shows resistance.
However, the index continued to rise, indicating that sellers were overwhelmed by buyers.
We would normally see a similar pattern at the April breakout, but low levels indicate an absence of sellers,
who would normally be expected to recoup some of their earlier losses as prices recovered.
These potential sellers remain in the wings
and could strengthen resistance at the previous high of 14000.
S&P 500
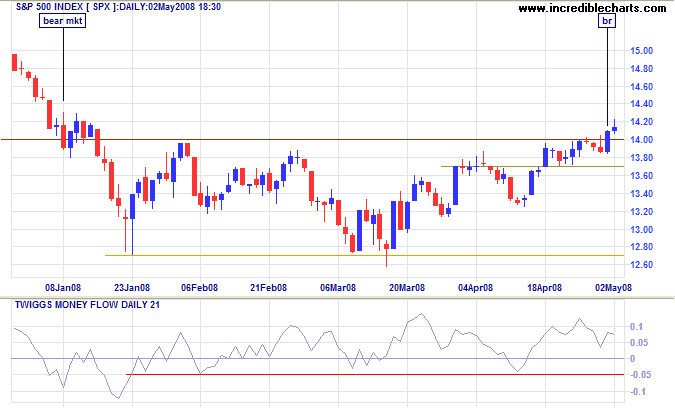
The S&P 500 broke through resistance at 1400, confirming the Dow reversal to an up-trend. Twiggs Money Flow holding above zero signals buying pressure. Look for confirmation from a retracement that respects the new support level.
Small Caps
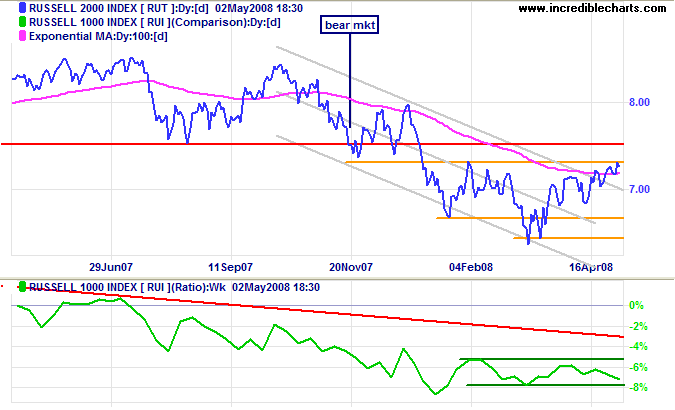
The Russell 2000 broke out of its trend channel and is testing resistance at 730, lagging the large cap indices. Large caps are likely to lead the recovery: expect the ratio against the Russell 1000 to fall.
Technology
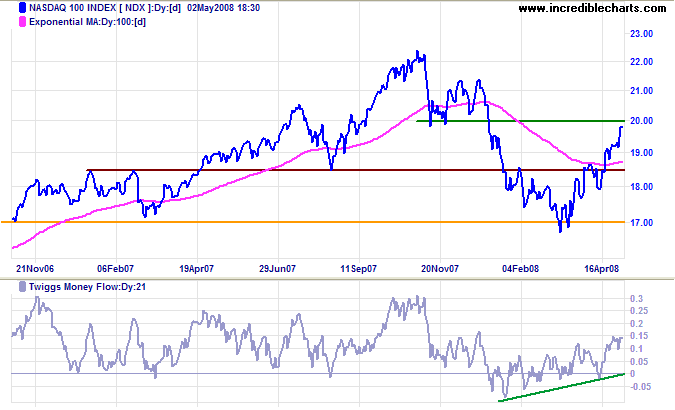
The Nasdaq 100 was least affected by the housing market collapse and recovered fastest, testing resistance at 2000, half-way to the earlier high of 2200. Twiggs Money Flow shows buying pressure rising.
Transport
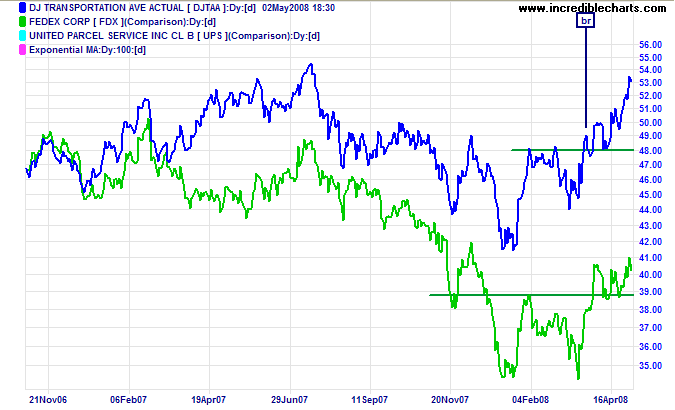
The Dow Jones Transportation Average has climbed steeply since commencing a primary up-trend. Fedex also confirmed a primary up-trend. A positive sign for the economy.
United Kingdom: FTSE
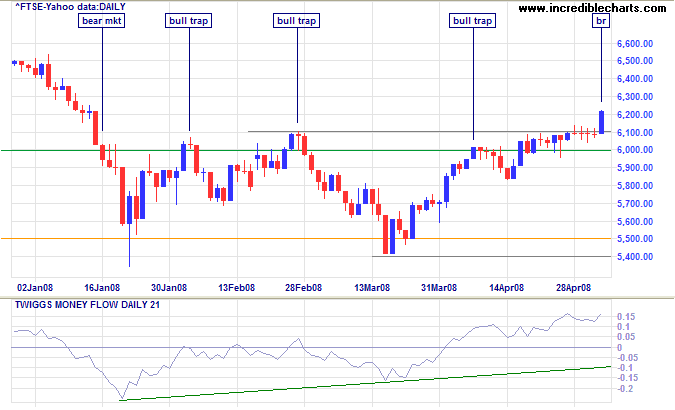
The FTSE 100 broke through resistance at 6100, signaling reversal to a primary up-trend. Twiggs Money Flow indicates strong buying pressure. Expect a short retracement to confirm the new support level, followed by a test of the 2007 highs at 6750.
India: Sensex
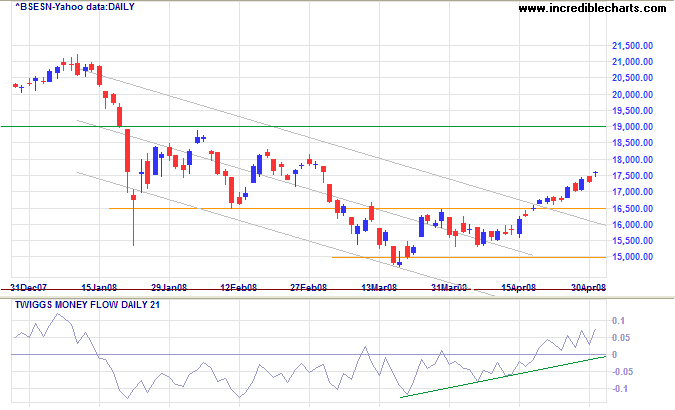
The Sensex broke out of its trend channel, indicating the down-trend has weakened. Expect a short retracement to confirm the new support level at 16500, followed by a test of primary resistance at 19000. Rising Twiggs Money Flow reflects buying pressure.
Japan: Nikkei
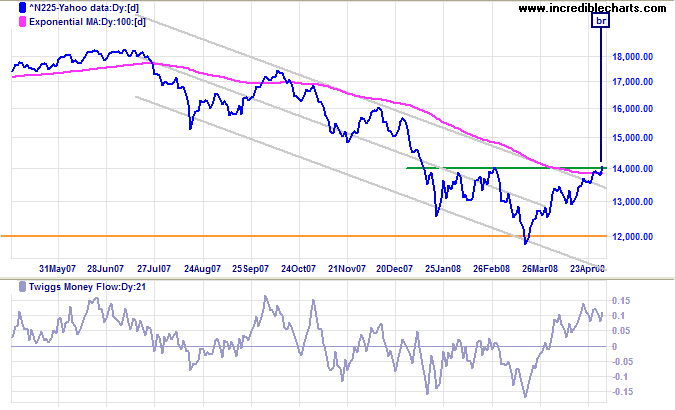
The Nikkei 225 broke above 14000, signaling reversal to a primary up-trend. Twiggs Money Flow, confirms strong buying pressure.
China: Hang Seng & Shanghai
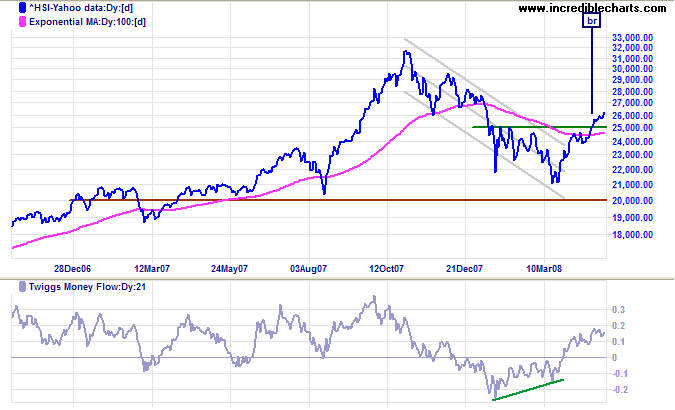
The Hang Seng index broke through 25000, reversing to a primary up-trend. Rising Twiggs Money Flow signals strong buying pressure. Expect a test of the 2007 high at 32000.
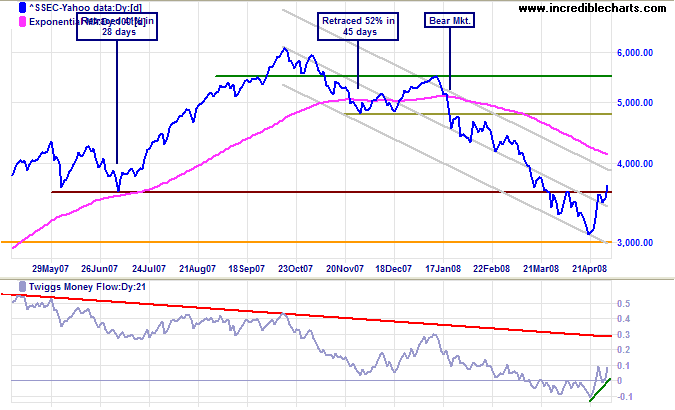
Even the Shanghai Composite shows signs of recovery, with Twiggs Money Flow crossing to above zero, reflecting short-term buying pressure. Expect a short retracement to confirm support at 3600 followed by a test of resistance at 4800.
Australia: ASX
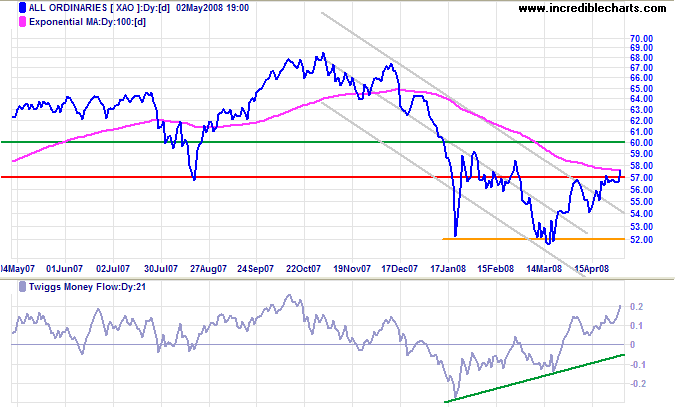
The All Ordinaries broke through medium-term resistance at 5700 after Wednesday's long tail and strong volume signaled accumulation (buying pressure). Expect a test of 6000. Reversal below 5700 is unlikely, given the bullish signals from the Dow and FTSE 100, and would warn of another test of 5200.
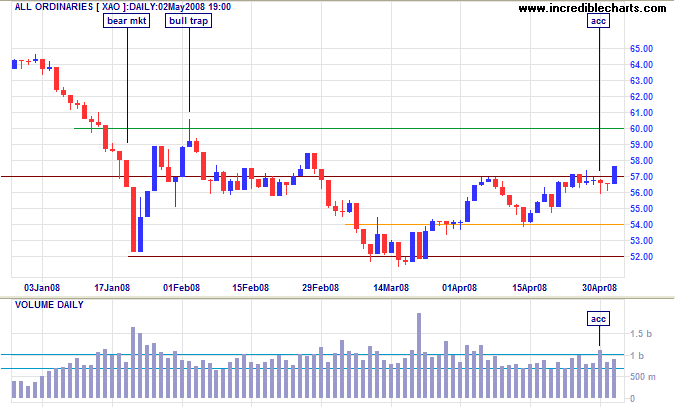
Long Term: Penetration of 6000 would signal a primary up-trend. Twiggs Money Flow high above zero signals strong buying pressure.
Life is a school of probability.
~
Walter Bagehot
To understand my approach, please read Technical Analysis & Predictions in About The Trading Diary.

Author: Colin Twiggs is a former investment banker with almost 40 years of experience in financial markets. He co-founded Incredible Charts and writes the popular Trading Diary and Patient Investor newsletters.
Using a top-down approach, Colin identifies key macro trends in the global economy before evaluating selected opportunities using a combination of fundamental and technical analysis.
Focusing on interest rates and financial market liquidity as primary drivers of the economic cycle, he warned of the 2008/2009 and 2020 bear markets well ahead of actual events.
He founded PVT Capital (AFSL No. 546090) in May 2023, which offers investment strategy and advice to wholesale clients.
