Beware Of A Bull Trap
By Colin Twiggs
April 19, 3:00 a.m. ET (5:00 p.m. AET)
These extracts from my trading diary are for educational purposes and should not be interpreted as investment or trading advice. Full terms and conditions can be found at Terms of Use.
Overview
The Dow Industrial Average broke through resistance at 12800, but the breakout has not been confirmed by the S&P 500 and should be treated with caution. The Nikkei, Hang Seng and Sensex indices look promising, but have not yet reversed their primary trend. The resources sector shows signs of recovery in Australia, but the Shanghai index warns of problems in mainland China.
USA
Dow Jones Industrial Average
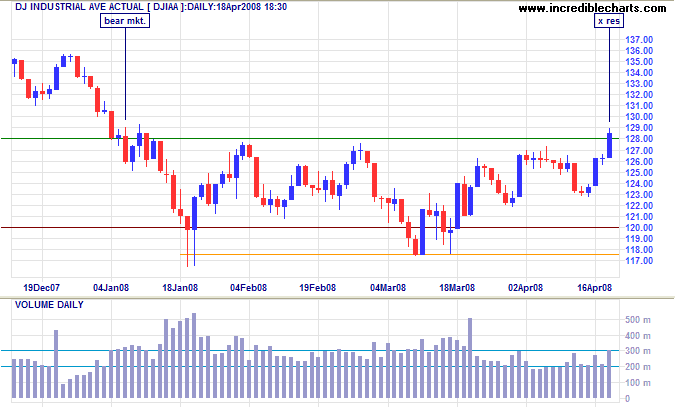
The Dow broke through resistance at 12800 on strong volume. A retracement that respects the new support level would add strength to the signal. Reversal below Friday's low, on the other hand, would warn of a bull trap and another test of support at 12000/11750.
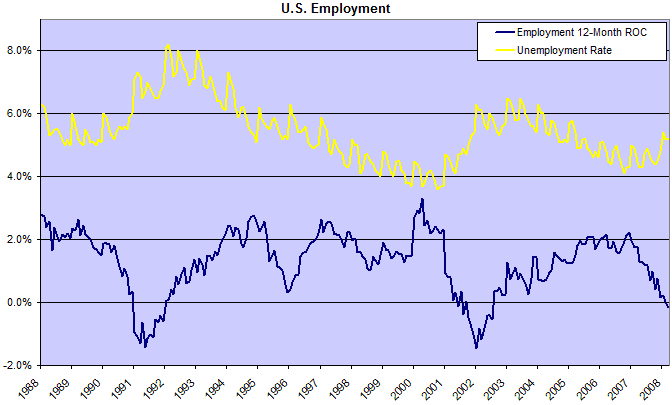
First-quarter earnings have so far been mixed, with Standard & Poors estimating reported earnings per share to fall roughly 30 percent compared to the same quarter in 2007. An equivalent fall would see the S&P 500 index at 1100. Even if the Dow by comparison suffered only a 20 percent fall, that would take it as low as 11000. Also bear in mind that falling employment is likely to have an increasing impact on consumption and corporate earnings over the next few quarters.
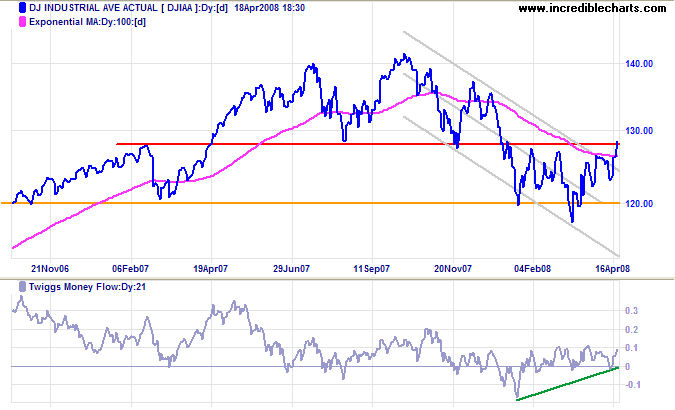
Long Term: Breakout above the trend channel indicates that the down-trend is weakening, while Twiggs Money Flow holding above zero (in the medium term) signals buying pressure. I am wary of a bull trap and will remain so until there is strong evidence to the contrary.
S&P 500
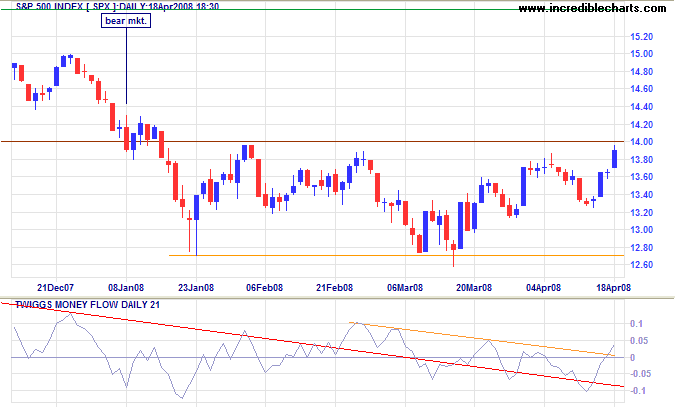
The S&P 500 is testing resistance at 1400. Twiggs Money Flow crossed to above zero, but has not yet established an up-trend (of higher peaks and troughs). A rise above 1400 would confirm the Dow breakout, but a retracement would have to respect the new support level before I accept that this is not a bull trap. Respect of resistance, on the other hand, would signal a test of support at 1275.
Small Caps
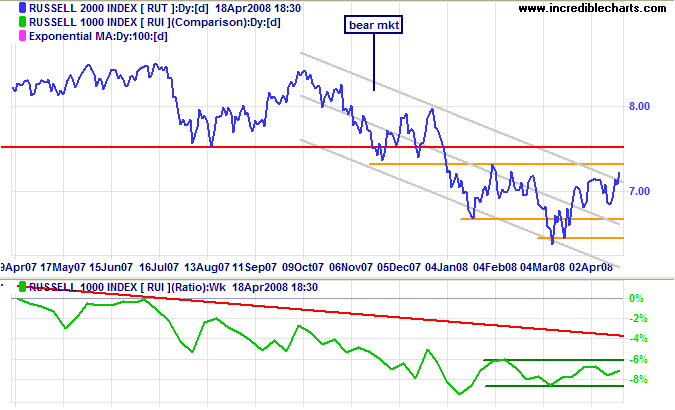
The Russell 2000 broke out of the trend channel, indicating that the primary down-trend has weakened. Expect a test of resistance at 730. The ratio against the Russell 1000 is moving sideways; upward breakout from the narrow channel would be another positive sign for the market. Downward breakout, however, remains as likely and would warn of another primary decline.
Technology
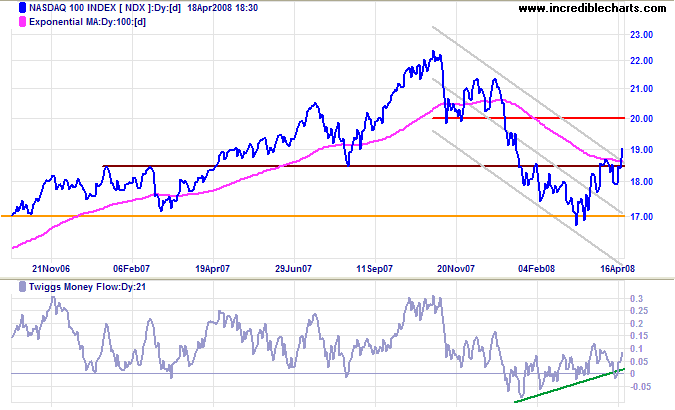
The Nasdaq 100 displays similar positive signs: upward breakout from the trend channel and rising Twiggs Money Flow, indicating short-term buying pressure. Retracement to test the new (1850) support level would offer confirmation of the breakout and offer a target of 2000 in the medium term.
Transport
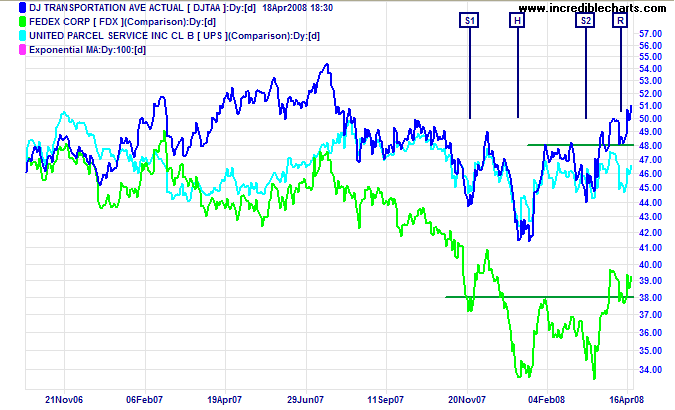
The Dow Jones Transportation Average and Fedex have reversed to a primary up-trend — a positive sign for the economy.
United Kingdom: FTSE
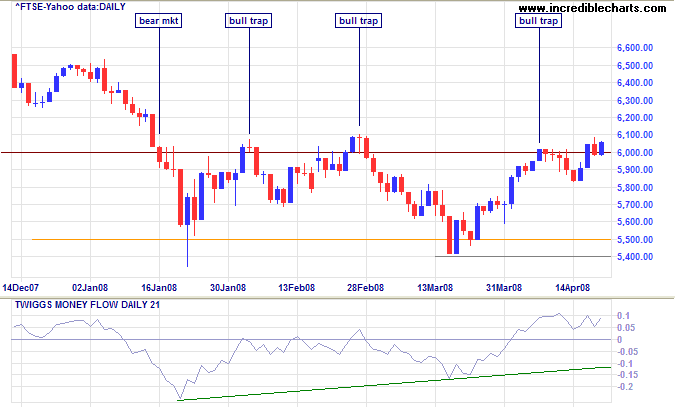
The FTSE 100 again penetrated resistance at 6000, but this time the next day's retracement respected the new support level. Twiggs Money Flow oscillating above zero signals strong short-term buying pressure. A rise above 6100 would confirm the breakout, offering a target of 6500/6600. Reversal below 6000 would warn of a test of support at 5500.
India: Sensex
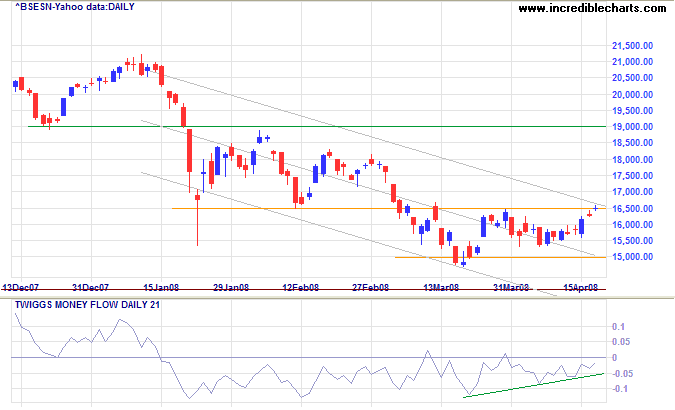
The Sensex is testing the upper trend channel and resistance at 16500. Respect would warn of a down-swing to 15000, while breakout would indicate that the primary down-trend has weakened. Rising Twiggs Money Flow signals short-term buying, but has no longer term significance unless it crosses to above zero.
Japan: Nikkei
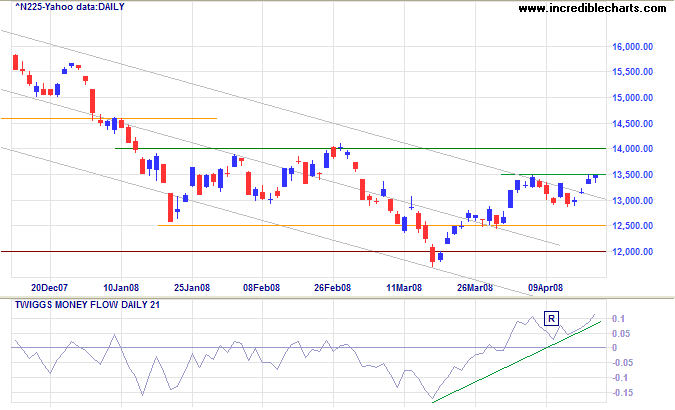
The Nikkei 225 broke above the trend channel, while rising
Twiggs Money Flow,
with retracements [R] respecting the zero line, signals strong buying pressure.
A rise above 13500 would confirm the breakout and indicate a test of primary resistance at 14000.
In the long term, a rise above 14000 would signal a primary up-trend.
China: Hang Seng & Shanghai
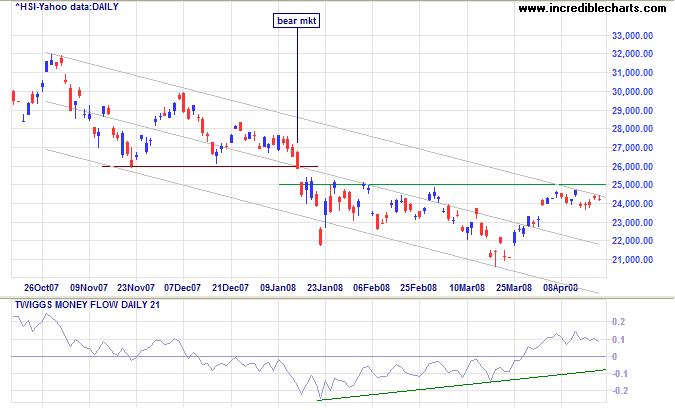
The Hang Seng index shows similar signals to the Sensex: testing the upper trend channel and rising Twiggs Money Flow reflecting buying pressure. Breakout above 25000 (while January - February may not be a classic line) but would signal reversal to a primary up-trend. Respect of 25000, however, would indicate another test of the lower channel.
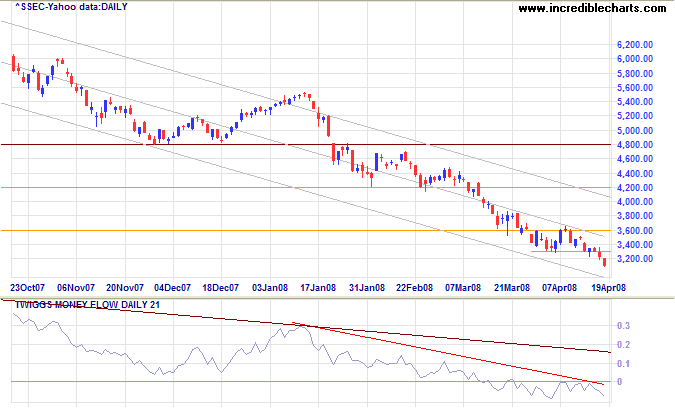
Mainland China faces a credit squeeze as the government combats rising inflation: consumer prices growing at above 8 percent per year (Associated Press). The Shanghai Composite continues in a strong primary down-trend, breaking short-term support at 3300 and headed for a test of the lower trend channel at 3000. Twiggs Money Flow signals both long- and short-term selling pressure.
Australia: ASX
The All Ordinaries is likely to follow Friday's bullish Dow index and test resistance at 5700. Breakout would encounter resistance at 6000, while a fall below 5400 would test support at 5200.
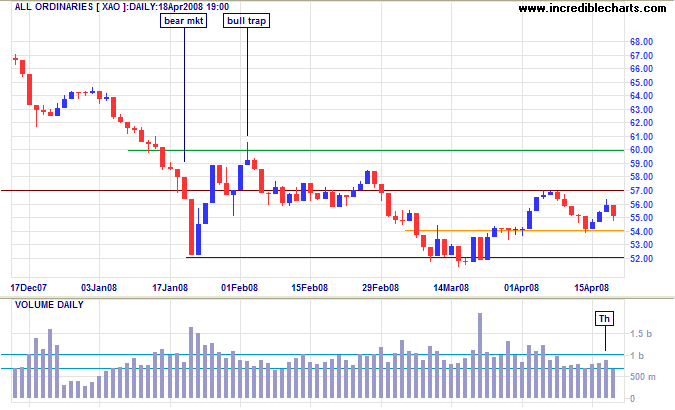
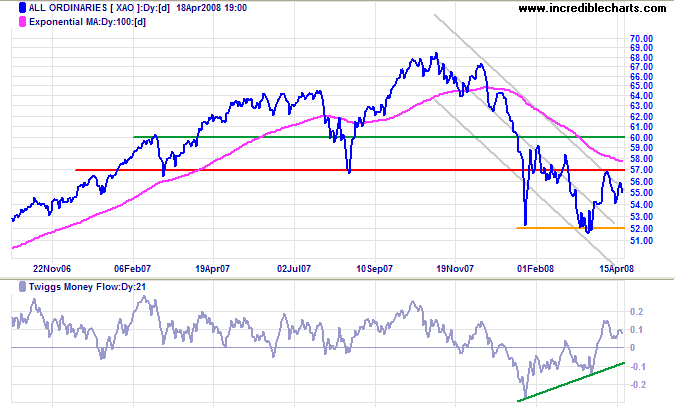
Long Term: Failure of support at 5200 would warn of a primary decline, with a target of the June 2006 low of 4800. Rising Twiggs Money Flow, however, signals buying pressure, and breakout above 6000 would signal reversal to a primary up-trend.
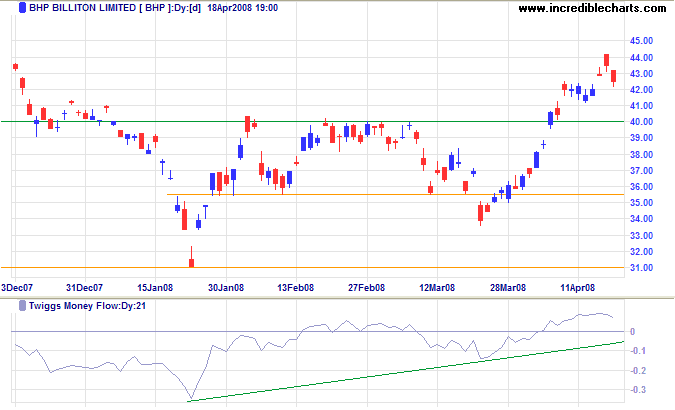
Mining giant BHP is retracing after breaking through resistance at $40.00. Rio Tinto follows a similar pattern. Respect of the new support level would confirm the primary up-trend — a positive signal for the resources sector.
Remember this: When you are doing nothing, those speculators who feel they must trade day in and day out,
are laying the foundation for your next venture.
You will reap benefits from their mistakes.
~
Jesse Livermore in Edwin Lefevre's
Reminiscences Of A Stock Operator
To understand my approach, please read Technical Analysis & Predictions in About The Trading Diary.

Author: Colin Twiggs is a former investment banker with almost 40 years of experience in financial markets. He co-founded Incredible Charts and writes the popular Trading Diary and Patient Investor newsletters.
Using a top-down approach, Colin identifies key macro trends in the global economy before evaluating selected opportunities using a combination of fundamental and technical analysis.
Focusing on interest rates and financial market liquidity as primary drivers of the economic cycle, he warned of the 2008/2009 and 2020 bear markets well ahead of actual events.
He founded PVT Capital (AFSL No. 546090) in May 2023, which offers investment strategy and advice to wholesale clients.
