Stocks & Indexes
By Colin Twiggs
October 7, 2006 0:30 a.m. ET (2:30 p.m. AET)
October 7, 2006 0:30 a.m. ET (2:30 p.m. AET)
To understand my approach to Technical Analysis, please read
Trading Diary Predictions.
These extracts from my daily trading diary are for educational purposes and should not be interpreted as investment advice. Full terms and conditions can be found at Terms of Use.
The next newsletter (an update on Gold, Crude Oil and the Dollar) will be on October 10th.
These extracts from my daily trading diary are for educational purposes and should not be interpreted as investment advice. Full terms and conditions can be found at Terms of Use.
The next newsletter (an update on Gold, Crude Oil and the Dollar) will be on October 10th.
The Big Picture
The Dow made a clear breakout above 11750
to a new all-time high, a strong bull signal. Bullish signs are
also reflected in other equity markets, though the Dow Transportation Average still reflects some
weakness. Falling fuel costs and lower long-term interest rates
may stimulate the economy, but too fast a recovery would raise
inflationary pressures and revive fears of further rate
hikes.
Gold is trending downwards to test primary support at $540/$543. Failure of support would signal the start of a primary down-trend. Crude oil is testing support at $60/barrel, while the dollar is strengthening in the short-term. The probability of recession in the next four quarters increased to 38 per cent according to the Wright model.
Gold is trending downwards to test primary support at $540/$543. Failure of support would signal the start of a primary down-trend. Crude oil is testing support at $60/barrel, while the dollar is strengthening in the short-term. The probability of recession in the next four quarters increased to 38 per cent according to the Wright model.
USA
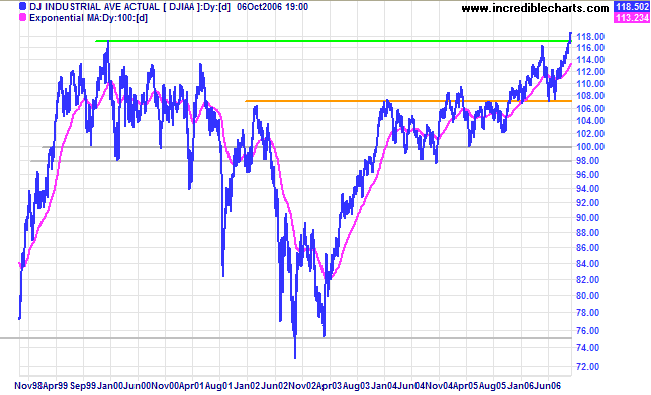
After a bullish narrow consolidation, the Dow Industrial
Average broke through resistance at the all-time high of
11750 set in January 2000. Narrow ranges on Thursday and Friday
signal short-term resistance, but a follow-through above
Thursday's high, or a retracement that respects the new support
level (11750), would confirm the breakout.
Reversal below 11650, though unlikely, would warn of a bull trap.
Reversal below 11650, though unlikely, would warn of a bull trap.
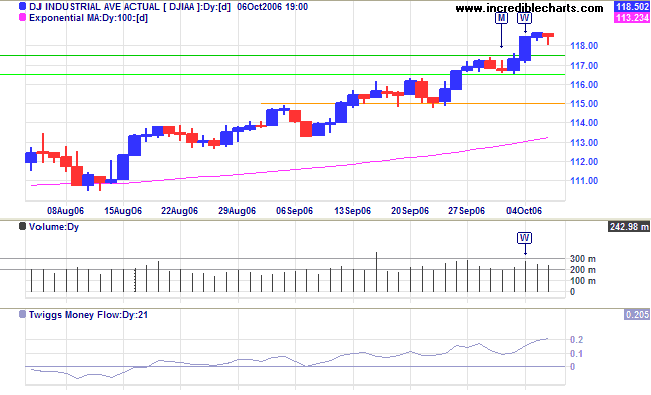
Medium Term:
Twiggs Money Flow (21-day) trending upwards while above the
zero line signals strong accumulation. The index has also held
above the 100-day moving
average for ten weeks, another sign of a strong
up-trend.
Long Term: The Dow remains in a primary up-trend, with support at 10700.
Long Term: The Dow remains in a primary up-trend, with support at 10700.
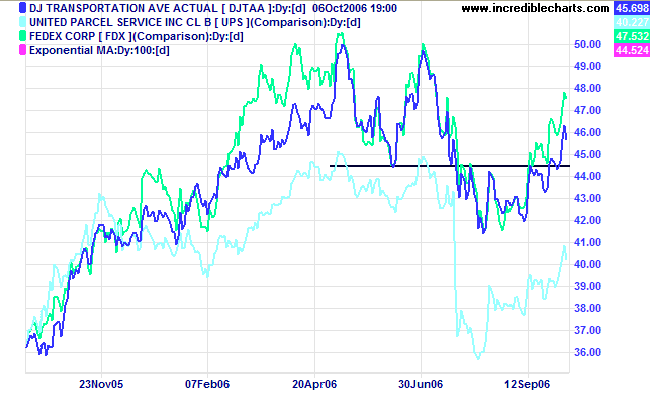
The Dow Jones Transportation Average reversed above the
first line of resistance (4450) and the latest retracement
respected the new support level, warning us to expect another
test of resistance at 5000. A break above 5000 would signal
reversal to a primary up-trend. I suspect that the latest
recovery is more a function of lower fuel costs than an
increase in economic activity, but this will nonetheless have a
stimulatory effect on the economy.
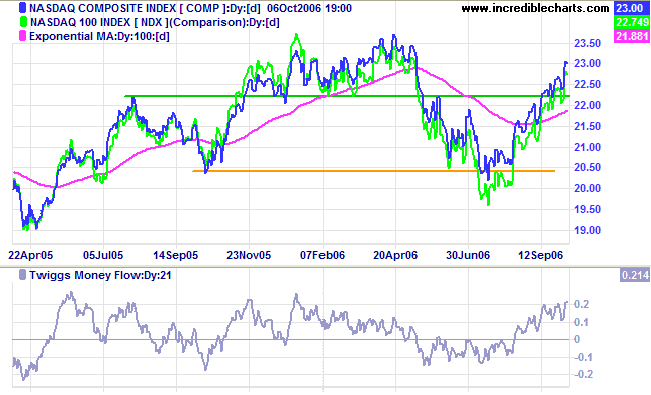
The Nasdaq Composite Index shows intermediate bullish
signs, rallying strongly above the 100-day moving
average and headed for a test of the April high of 2370.
Twiggs Money Flow (21-day) rising above zero, signals
strong
accumulation in the medium-term.
The latest retracement on the S&P 500 respected the
new support level at 1325, confirming the recent breakout. The
target for the breakout is 1425 (1325 + {1325 - 1225}). Expect
a test of the upper border of the linear regression channel.
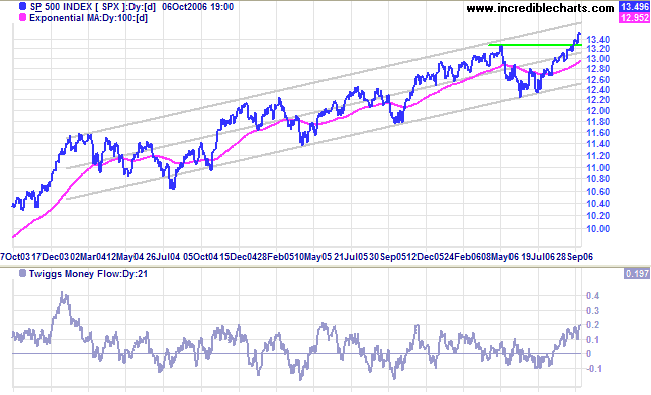
Medium Term:
Twiggs Money Flow (21-day) rising above zero signals
(medium-term) accumulation.
Long Term: Though still some way from its all-time high of 1550, the S&P 500 continues in a slow primary up-trend with support at 1220.
Long Term: Though still some way from its all-time high of 1550, the S&P 500 continues in a slow primary up-trend with support at 1220.
United Kingdom
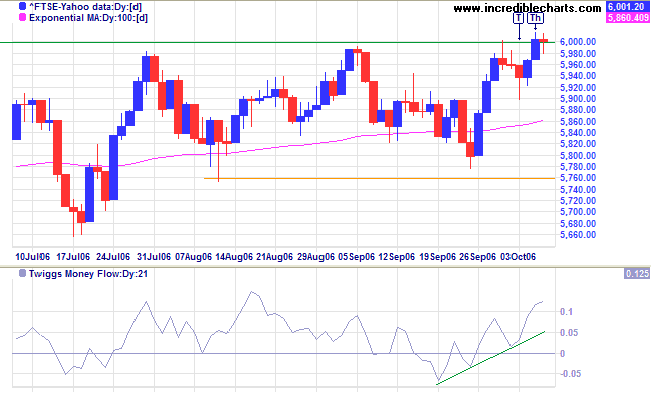
Following a bullish short retracement below resistance at 6000, the FTSE 100 broke out on Thursday [Th]. Friday's doji, however, signals uncertainty -- reversing below the new support level before recovering to close at 6001. A follow-through above Thursday's high would be a bullish sign, while reversal below Friday's low would confirm a false break.
Medium Term: Twiggs Money Flow (21-day) trending upwards, with the last retracement respecting the zero line, signals strong (medium-term) accumulation. The up-trend is likely to continue, with a target of 6700 from the break above 6100 (calculated as 6100 + {6100 - 5500}).
Long Term: The primary trend is up, with support at 5500.
Japan
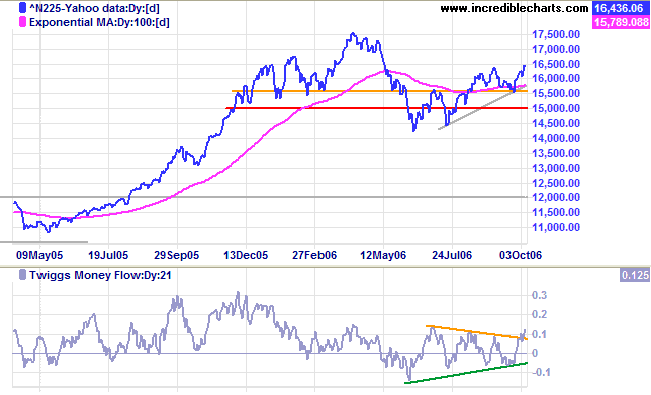
The Nikkei 225 broke through intermediate resistance at 16400, confirming a strong up-trend.
Medium Term: Twiggs Money Flow (21-day) is improving, breaking out of the consolidation around the zero line. The latest rally is headed for a test of the April high of 17500.
Long Term: The index resumed the primary up-trend, with support at 14200.
ASX Australia
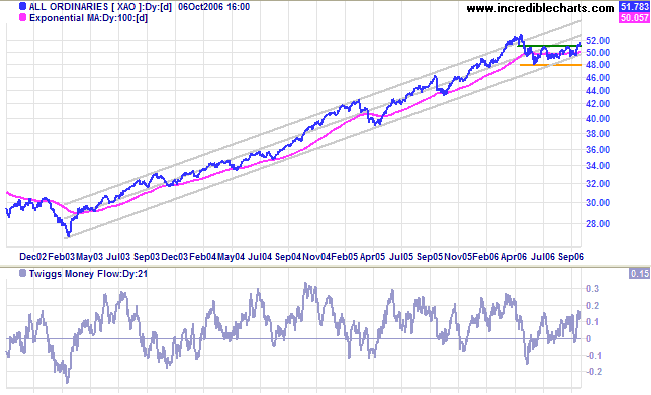
The All Ordinaries completed a short retracement [W] that respected the new support level of 5100, confirming the breakout. A tall blue candle followed on strong volume [Th], before a narrow range and strong volume on Friday warned of further resistance. Follow-through above Friday's high would be an indication of trend strength, while reversal below the mid-point of Thursday's tall candle would complete a shooting star, signaling another test of support at 5100.
The All Ordinaries completed a short retracement [W] that respected the new support level of 5100, confirming the breakout. A tall blue candle followed on strong volume [Th], before a narrow range and strong volume on Friday warned of further resistance. Follow-through above Friday's high would be an indication of trend strength, while reversal below the mid-point of Thursday's tall candle would complete a shooting star, signaling another test of support at 5100.
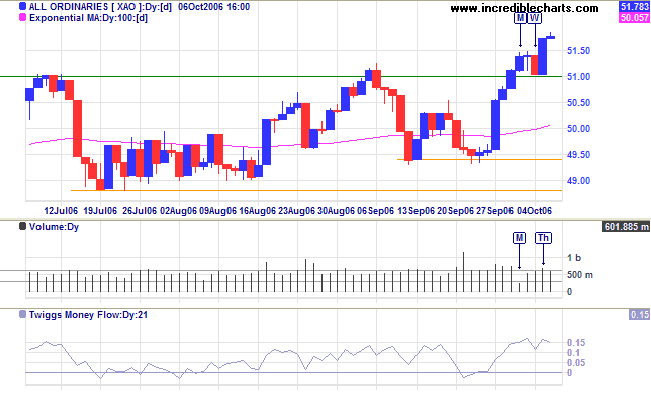
Medium Term: Breakout above 5100 completed a large
ascending triangle, with a target of 5400 (5100 + {5100 -
4800}). Expect a test of the upper border of the regression
channel below (after overcoming resistance at 5300/5350).
Twiggs Money Flow (21-day) holding above zero signals
long-term accumulation.
Long Term: The All Ordinaries continues in a primary up-trend with support at 4800.
Long Term: The All Ordinaries continues in a primary up-trend with support at 4800.
Conditions are never just right.
People who delay action until all factors are favorable do nothing.
~ William Feather
People who delay action until all factors are favorable do nothing.
~ William Feather

Author: Colin Twiggs is a former investment banker with almost 40 years of experience in financial markets. He co-founded Incredible Charts and writes the popular Trading Diary and Patient Investor newsletters.
Using a top-down approach, Colin identifies key macro trends in the global economy before evaluating selected opportunities using a combination of fundamental and technical analysis.
Focusing on interest rates and financial market liquidity as primary drivers of the economic cycle, he warned of the 2008/2009 and 2020 bear markets well ahead of actual events.
He founded PVT Capital (AFSL No. 546090) in May 2023, which offers investment strategy and advice to wholesale clients.