Stock Indexes
By Colin Twiggs
September 23, 2006 0:30 a.m. ET (2:30 p.m. AET)
September 23, 2006 0:30 a.m. ET (2:30 p.m. AET)
The next newsletter will be on September 29th -- I am going
sailing/snorkeling/fishing on an island for a few days.
These extracts from my daily trading diary are for educational purposes and should not be interpreted as investment advice. Full terms and conditions can be found at Terms of Use.
These extracts from my daily trading diary are for educational purposes and should not be interpreted as investment advice. Full terms and conditions can be found at Terms of Use.
The Big Picture
Low volumes still plague the Dow, raising doubts over its
ability to break through resistance at the all-time high of
11750. The Dow Transport Index is
consolidating below its new resistance level and, if lower fuel
costs are sustained, we could see a resurgence in economic
activity. Lower long-term interest rates may offer medium-term
relief to the beleaguered housing market, but this will be
unsustainable if economic activity recovers and inflationary
pressures resurface.
Gold weakened on the back of falling crude oil prices, but the dollar failed to strengthen -- indicating continued concerns over the state of the economy. The probability of recession in the next four quarters is still a modest 35 per cent according to the Wright model. If the dollar declines, gold is likely to strengthen.
Gold weakened on the back of falling crude oil prices, but the dollar failed to strengthen -- indicating continued concerns over the state of the economy. The probability of recession in the next four quarters is still a modest 35 per cent according to the Wright model. If the dollar declines, gold is likely to strengthen.
USA
The Dow Industrial Average is consolidating above the
first line of short-term support (11500) after briefly testing
resistance at the May high of 11650.
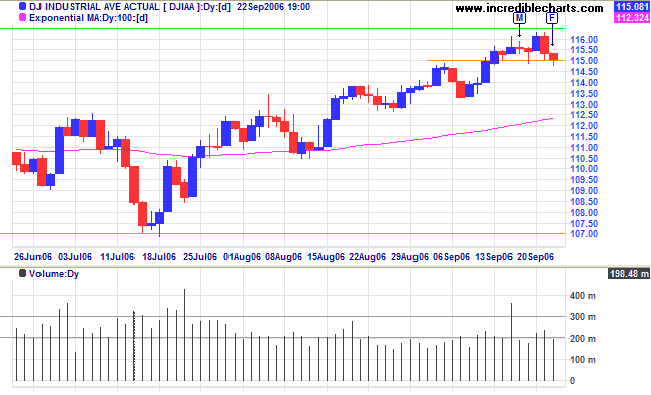
Medium Term: Continued narrow consolidation below the
resistance level would be a strong bullish sign, while a close
below 11330 would signal a retracement to test primary support
at 10700. I remain concerned over low volumes on the recent
August-September up-trend and question buyers' ability to break
through long-term resistance at 11650/11750.
Twiggs Money Flow (21-day), however, is rising above zero,
signaling accumulation.
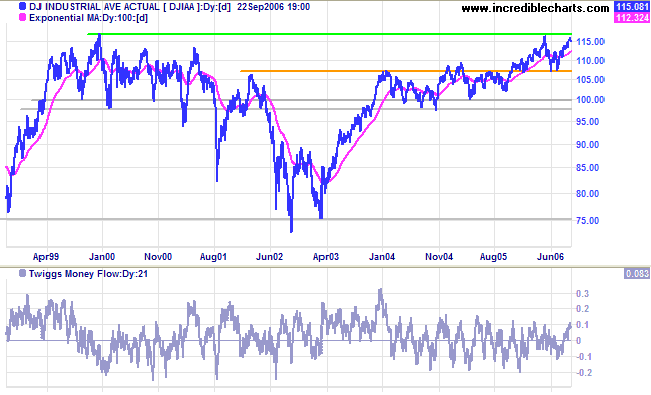
Long Term: The Dow continues in a primary up-trend, with resistance at the all-time high of 11750 and support at 10700. A longer-term view of Twiggs Money Flow (21-day) shows the indicator whipsawing around zero, indicating continued uncertainty.
Long Term: The Dow continues in a primary up-trend, with resistance at the all-time high of 11750 and support at 10700. A longer-term view of Twiggs Money Flow (21-day) shows the indicator whipsawing around zero, indicating continued uncertainty.
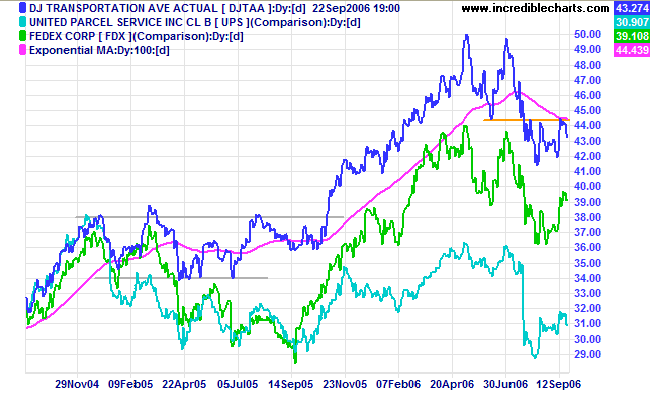
The Dow Jones Transportation Average respected
resistance at 4450 (the former primary support level). A
down-swing that carries below the August low of 4140 would
confirm the primary down-trend. On the other hand, continued
failure to break below 4140 (or a rise above 4450) would signal
trend weakness. Lead indicators Fedex and UPS follow a similar
pattern, although this may reverse if lower fuel prices are
sustained.
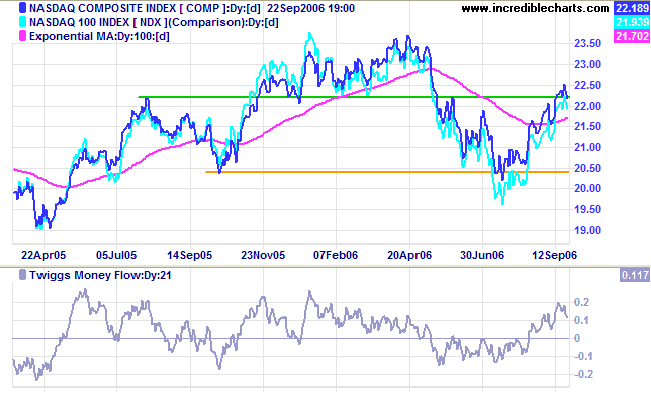
The Nasdaq Composite Index is rallying strongly above
the 100-day moving
average, signaling a healthy up-trend, and
Twiggs Money Flow (21-day) rising steeply above zero,
signals strong medium-term
accumulation. Expect a test of 2370.
The S&P 500 respected resistance at the May high of
1325. Narrow consolidation below this level (or an upward
breakout) would be a bullish sign, signaling a test of the
upper border of the linear regression channel.
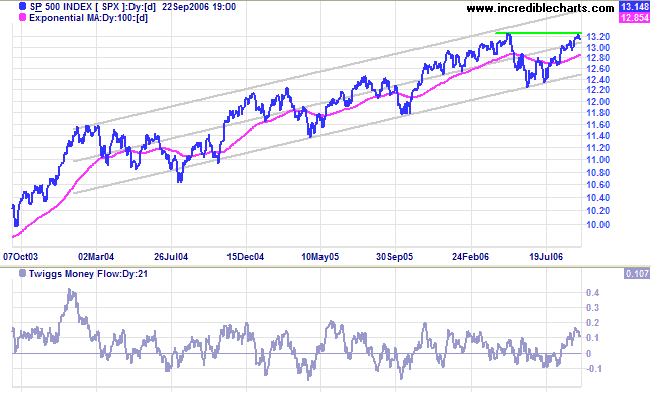
Medium Term:
Twiggs Money Flow (21-day) rising steeply above zero
signals medium-term accumulation.
Long Term: The S&P 500 continues in a slow primary up-trend, with support at 1220.
Long Term: The S&P 500 continues in a slow primary up-trend, with support at 1220.
United Kingdom
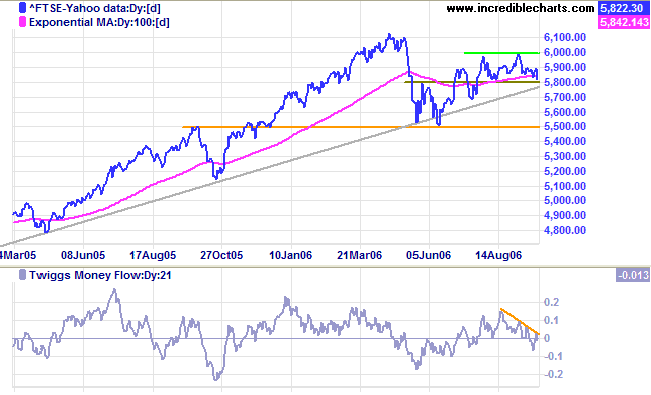
The FTSE 100 posted a large red candle on Friday, low volume signaling an absence of buying support. Penetration of support at 5800/5820 would also break the long-term trendline, warning of a primary trend reversal.
Medium Term: Twiggs Money Flow (21-day) is trending downwards, signaling medium-term distribution.
Long Term: The primary up-trend continues, with primary support at 5500.
Japan
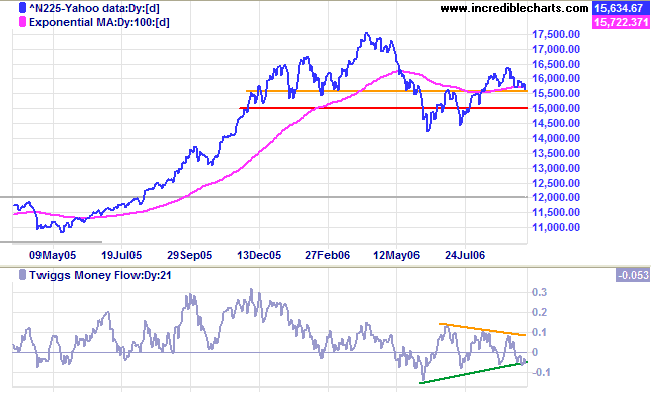
The Nikkei 225 closed below support at 15700 on Friday, signaling a slowing up-trend. A pull-back that respects the new resistance level would signal a test of primary support.
Medium Term: Twiggs Money Flow (21-day) continues to oscillate around the zero line, signaling uncertainty. The next target for the up-trend is the April high of 17500, but we would need an improvement in TMF for this to occur.
Long Term: The primary up-trend remains up, with support at 14200.
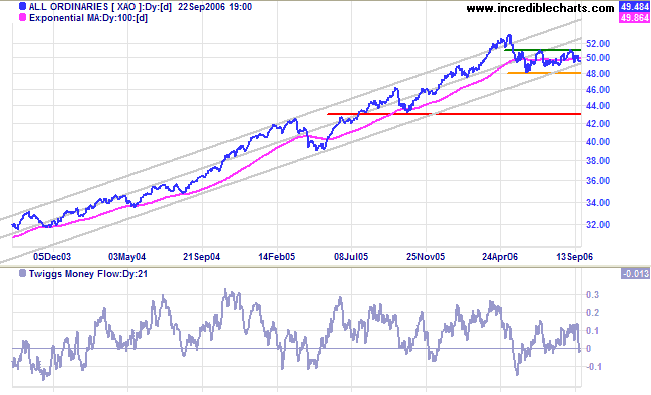
ASX Australia
The All Ordinaries intermediate down-swing encountered support at 4940 (last week's low). The tall shadow and exceptional volume on Thursday [Th] show sellers overwhelming an attempted rally, but buyers remain committed -- identified by a long tail and strong volume on Friday. Expect strong support between 4940 and 4880.
The All Ordinaries intermediate down-swing encountered support at 4940 (last week's low). The tall shadow and exceptional volume on Thursday [Th] show sellers overwhelming an attempted rally, but buyers remain committed -- identified by a long tail and strong volume on Friday. Expect strong support between 4940 and 4880.
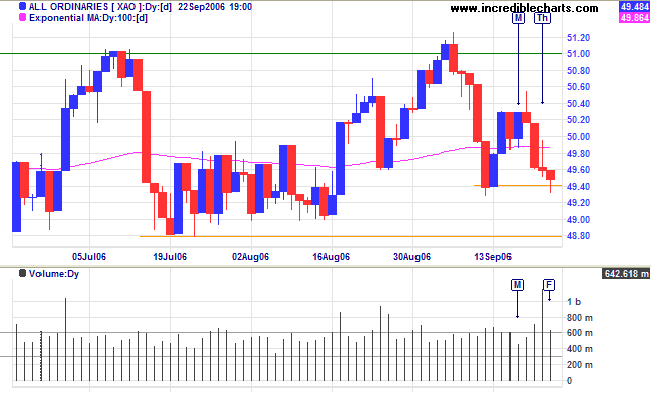
Medium Term: Failure of sellers to test 4880 would be a
bullish sign, signaling that buyers still have the upper hand.
A rise above 5100 would signal a test of the upper border of
the regression channel (after overcoming resistance at
5300/5350). A break below 4880, however, would signal that the
down-trend has resumed.
Twiggs Money Flow (21-day) dipped below zero, signaling
short-term
distribution, but remains positive in the longer
term.
Long Term: The All Ordinaries continues in a primary up-trend with support at 4800.
My reference to 4800 as the primary support level is open to debate. We had a secondary correction from 5300 to 4800, followed by a recovery to test resistance at 5100, then narrow consolidation between 4900 and 5100 for the next 3 months. If we interpret the consolidation as a line, then 4800 is the primary support level. If not, then 4300 (or even 3900) remains as primary support for the present.
We must all suffer one of two things: the
pain of discipline or the pain of regret or
disappointment.
~ E James Rohn
~ E James Rohn
For more background information, read About
the Trading Diary.

Author: Colin Twiggs is a former investment banker with almost 40 years of experience in financial markets. He co-founded Incredible Charts and writes the popular Trading Diary and Patient Investor newsletters.
Using a top-down approach, Colin identifies key macro trends in the global economy before evaluating selected opportunities using a combination of fundamental and technical analysis.
Focusing on interest rates and financial market liquidity as primary drivers of the economic cycle, he warned of the 2008/2009 and 2020 bear markets well ahead of actual events.
He founded PVT Capital (AFSL No. 546090) in May 2023, which offers investment strategy and advice to wholesale clients.