Trading Diary
June 11, 2005
These extracts from my daily trading diary are
for educational purposes and should not be interpreted as
investment advice. Full terms and conditions can be found at
Terms
of Use.
USA
The Dow Industrial Average continues to consolidate in a narrow range between 10400 and 10550, signaling hesitancy. There is lack of both buying and selling pressure, with no trend movement and low trading volumes. An upside breakout is most likely, with a close above 10560 signaling a test of resistance at 10900/11000; while a close below 10400 is still a reasonable possibility and would signal a re-test of support at 10000.
The Dow Industrial Average continues to consolidate in a narrow range between 10400 and 10550, signaling hesitancy. There is lack of both buying and selling pressure, with no trend movement and low trading volumes. An upside breakout is most likely, with a close above 10560 signaling a test of resistance at 10900/11000; while a close below 10400 is still a reasonable possibility and would signal a re-test of support at 10000.
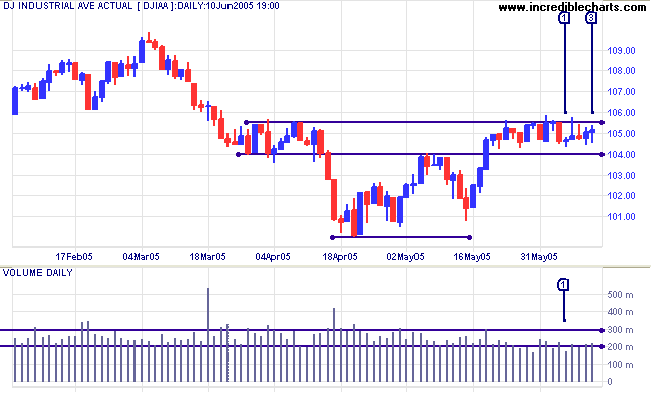
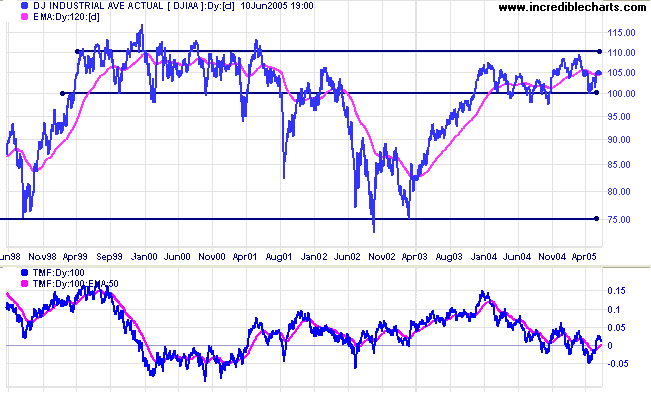
The last year has established strong support at 10000/9750. There
is also strong resistance at 11000/11500, shown by price action
from 1999 to 2001 and by recent highs in 2005. I expect to see a
lot more price action between these levels before there is a
clear breakout.
Twiggs Money Flow (100-day) signals short term accumulation, with a strong rise above the signal line, but the long-term outlook is bearish.
Twiggs Money Flow (100-day) signals short term accumulation, with a strong rise above the signal line, but the long-term outlook is bearish.
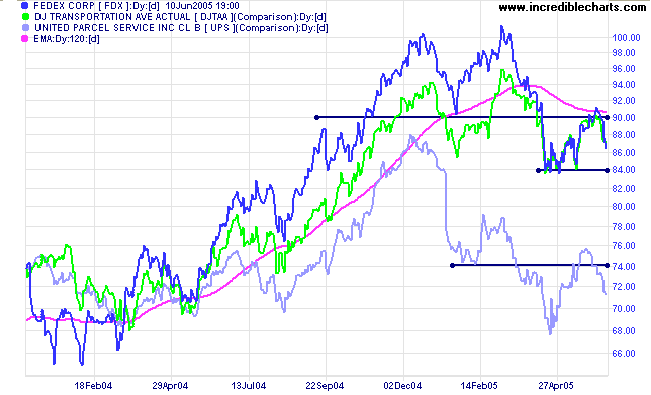
Three transport indicators all warn of a bearish outcome.
Fedex and UPS have both commenced primary
down-trends, while the Dow Transportation Average, having
given a weak bear signal in April, appears ready to follow suit.
Fedex will confirm that it is in a strong down-trend if it closes
below support at 84.00; UPS likewise, if it closes below its
April low.
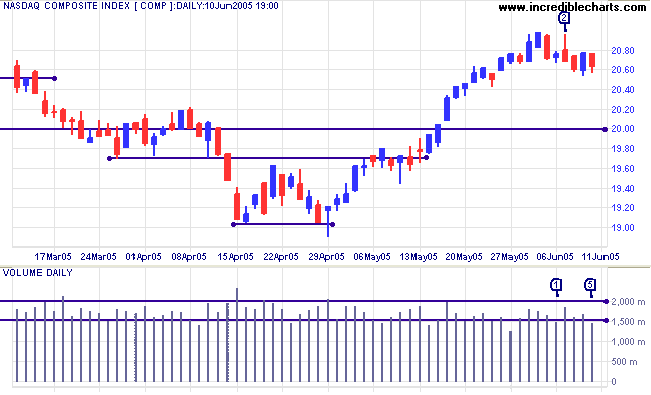
Trading volumes have dried up on the Nasdaq Composite,
with low activity especially noticeable at [1] and [5]. Monday's
attempted rally failed at [2] and the index appears headed for a
test of support at 2000/1900. A close below 1900 would
signal resumption of the primary down-trend; a close above 2180,
resumption of the primary up-trend.
The more speculative end of the market appears to be waiting for direction from the heavyweights.
The more speculative end of the market appears to be waiting for direction from the heavyweights.
The S&P 500 is adopting a similar pattern to the Dow,
consolidating between 1190 and 1205 over the last two to three
weeks. A close above 1225 would signal resumption of the primary
up-trend. A downward breakout that holds above 1160 would still
be positive; while a close below 1140 would be a strong bear
signal, signaling continuation of the primary down-trend.
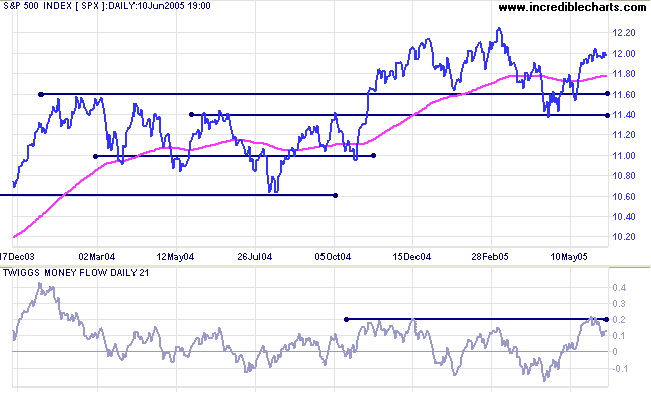
Twiggs Money Flow (21-day), displays some distribution over
the past two weeks but is still positive. A pull-back that holds
above the zero line would be a strong bull signal.
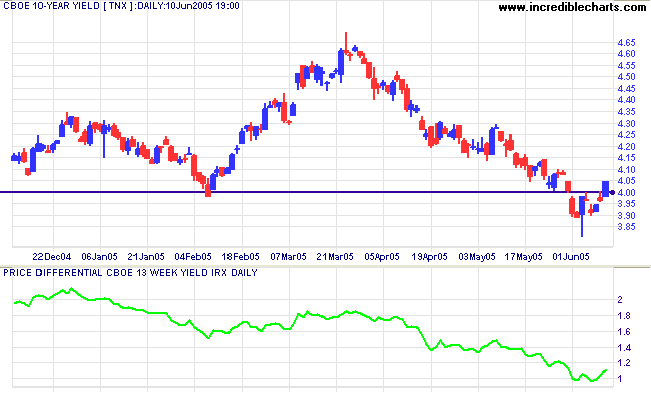
Treasury yields
The yield on 10-year treasury notes rallied strongly on Friday, to above 4.0%, after a marginal break. If the new support level holds over the next few days, expect a test of resistance at 4.60%. T-bills (13-week) are testing resistance at 3.0%; so the yield differential (10-year T-notes minus 13-week T-bills) is just over 1.0% -- a further decline would be a long-term bear signal for equities.
The yield on 10-year treasury notes rallied strongly on Friday, to above 4.0%, after a marginal break. If the new support level holds over the next few days, expect a test of resistance at 4.60%. T-bills (13-week) are testing resistance at 3.0%; so the yield differential (10-year T-notes minus 13-week T-bills) is just over 1.0% -- a further decline would be a long-term bear signal for equities.
Gold
New York: Spot gold has started an intermediate up-trend, rallying to $426.90 on Friday. Expect a test of resistance at the April high of $435.70. Failure to breach this would be a bearish sign; confirmed if the metal then falls below support at $415.
New York: Spot gold has started an intermediate up-trend, rallying to $426.90 on Friday. Expect a test of resistance at the April high of $435.70. Failure to breach this would be a bearish sign; confirmed if the metal then falls below support at $415.
$415 is at the base of a large (6-month)
triangle; while the primary trend will reverse downward if
price falls below support at the February low of $410.
ASX Australia
The All Ordinaries broke through resistance at 4140/4150 but the rally is running out of steam, with declining volume and a similar ascending flag pattern to early March 2005: [a] to [b]. This is where it gets interesting.
The All Ordinaries broke through resistance at 4140/4150 but the rally is running out of steam, with declining volume and a similar ascending flag pattern to early March 2005: [a] to [b]. This is where it gets interesting.
- If the index fails to break through resistance at 4255, we may see a sharp downward correction. One strong red candle could trigger a spate of selling.
- If the index breaks above 4255 and then retreats within a day or two (a false/marginal break), that would be an even stronger bear signal.
- The least likely scenario is a breakout followed by a pull-back that respects the new support level: a bullish signal.
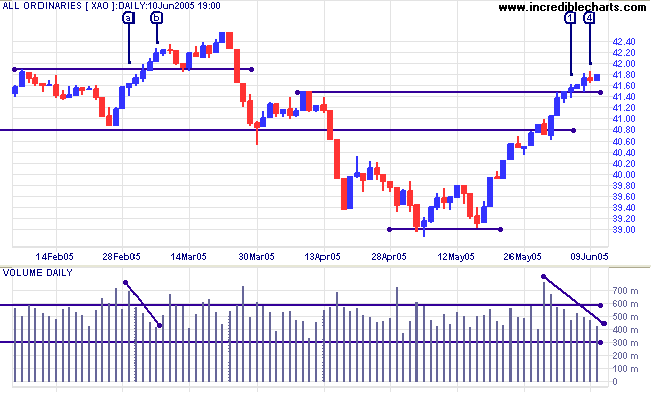
Twiggs Money Flow (21-day) signals strong accumulation in the
intermediate term.
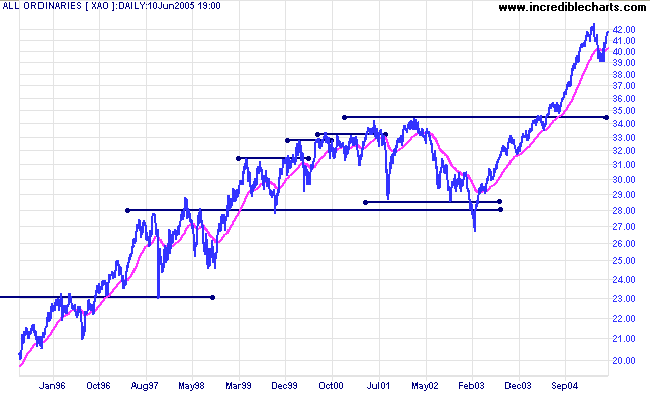
The most likely scenario is that we are at, or close to, a stage 3 top. My view is strongly influenced by two factors:
The most likely scenario is that we are at, or close to, a stage 3 top. My view is strongly influenced by two factors:
- the shape and extent of the previous rally, which resembles a spike; and
- the index is well above its previous support base.
For further assistance, read About
the Trading Diary.
Colin Twiggs
Engulfed by fear and suspicion,
we try desperately to invent ways out,
plan how to avoid
the obvious danger that threatens us so terribly.
Yet we're mistaken, that's not the danger ahead:
Another disaster, one we never imagined,
suddenly, violently, descends upon us,
and finding us unprepared - there's no time now -
sweeps us away.
~ C. P. Cavafy: Things Ended
Back Issues
Access the Trading Diary Archives.

Author: Colin Twiggs is a former investment banker with almost 40 years of experience in financial markets. He co-founded Incredible Charts and writes the popular Trading Diary and Patient Investor newsletters.
Using a top-down approach, Colin identifies key macro trends in the global economy before evaluating selected opportunities using a combination of fundamental and technical analysis.
Focusing on interest rates and financial market liquidity as primary drivers of the economic cycle, he warned of the 2008/2009 and 2020 bear markets well ahead of actual events.
He founded PVT Capital (AFSL No. 546090) in May 2023, which offers investment strategy and advice to wholesale clients.