Trading Diary
December 11, 2004
These extracts from my daily trading diary are for educational
purposes and should not be interpreted as investment advice. Full
terms and conditions can be found at Terms
of Use.
USA
The Dow Industrial Average is consolidating in a narrow band between 10600 and 10450.
Twiggs Money Flow (21-day) has so far held above zero, signaling accumulation.
A fall below 10450 is likely to test 10350. A fall through that level would test the major 10000 support level; as long as that holds we are still in a bull-trend.
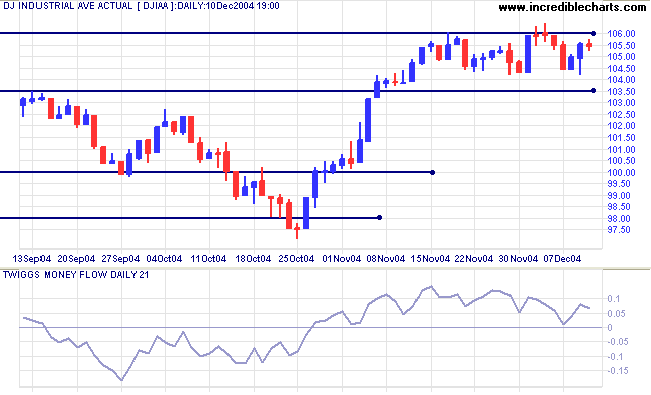
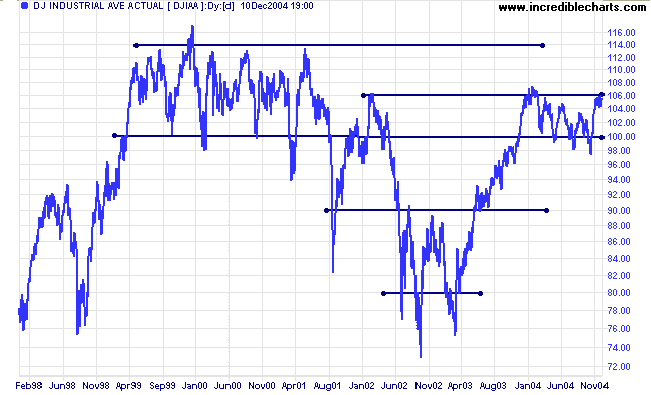
A breakout (not just a false break) above 10600 would signal that
11400 is likely to be tested. Though first expect a pull-back to
test support at the breakout.
A fall below 10000 would be a (long-term) bear signal.
A fall below 10000 would be a (long-term) bear signal.
The Nasdaq Composite experienced strong resistance, with
heavy volumes at 2150. A narrow consolidation below 2150, or a
correction that respects support at 2050, would both be
(long-term) bullish signs.
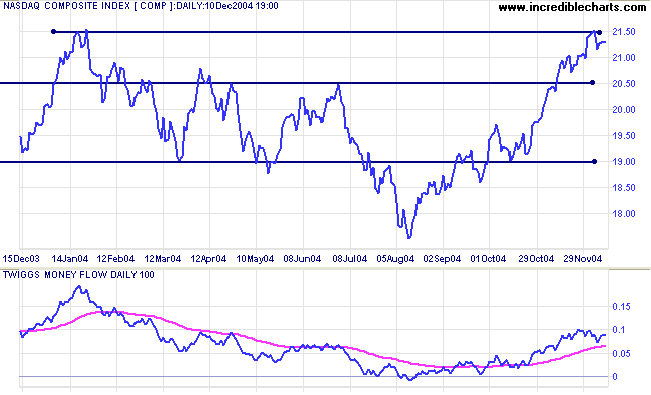
The primary trend is up and
Twiggs Money Flow is well above its' signal line, signaling
accumulation.
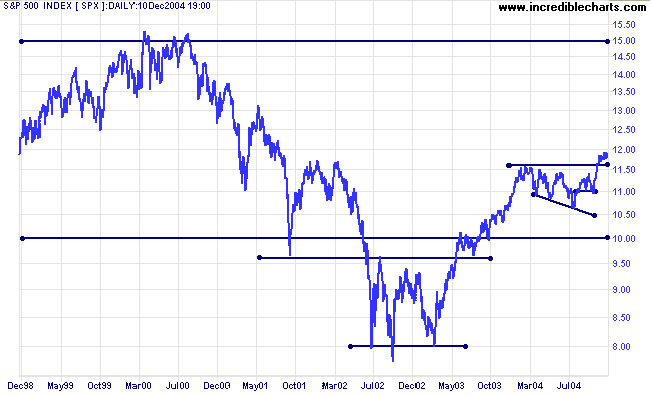
The S&P 500 is edging upwards in a narrow flag
pattern. This consolidation pattern normally signals continuation
of the up-trend, but we must consider the close proximity to the
breakout above 1160 (and the fact that the Dow and Nasdaq are
encountering resistance). We are likely to see another test of
the 1160 support level, especially after last week's two dojis
on strong volume at the upper border of the pattern. A successful
test of support at 1160, or a breakout above the upper border of
the flag pattern (not just a false break), would be a bull
signal.
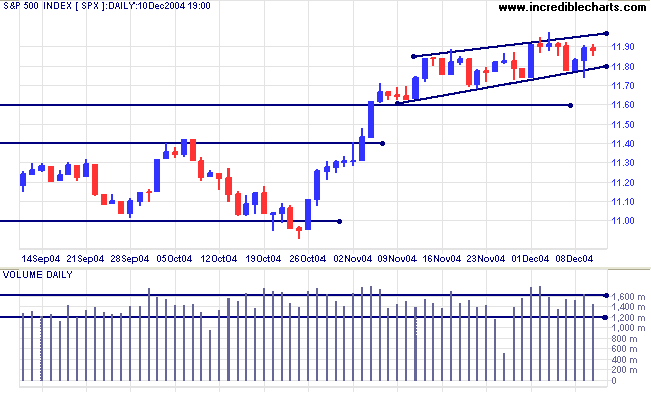
Twiggs Money Flow continues to signal strong
accumulation.
The primary trend is up. With no major resistance levels overhead we can expect good (long-term) gains.
The primary trend is up. With no major resistance levels overhead we can expect good (long-term) gains.
|
|
Treasury yields
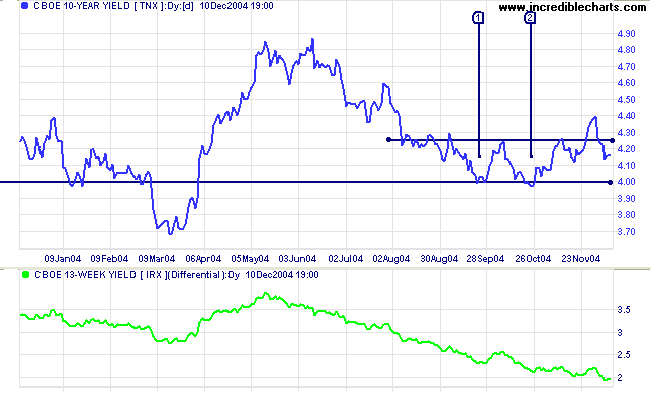
The breakout above 4.25% failed to live up to expectations, retreating back below the new support level. We could see another test of support at 4.00%. Soft long-term yields indicate that there is no major outflow from the bond market (into equities).
The yield differential (10-year T-notes minus 13-week T-bills) has declined below 2.0%. A steep rise in short-term yields reflects recent rate hikes by the Fed. A differentials below 1.0% would be bearish.
Gold
New York: Spot gold failed to hold above $450 and has retreated to test support at $430, closing at $433.40. A successful test would be a bullish sign, signaling another attempt to break above $450.
New York: Spot gold failed to hold above $450 and has retreated to test support at $430, closing at $433.40. A successful test would be a bullish sign, signaling another attempt to break above $450.
|
ASX Australia
The All Ordinaries (and ASX 200) made only marginal gains before retreating to test support at 3900 (xjo: 3880). Strong volumes on Friday signal buying support but the weak close reveals committed sellers. The index is experiencing increased resistance as it approaches 4000. Marginal new highs and strong volumes on corrections will increase the likelihood of a major secondary correction.
The All Ordinaries (and ASX 200) made only marginal gains before retreating to test support at 3900 (xjo: 3880). Strong volumes on Friday signal buying support but the weak close reveals committed sellers. The index is experiencing increased resistance as it approaches 4000. Marginal new highs and strong volumes on corrections will increase the likelihood of a major secondary correction.
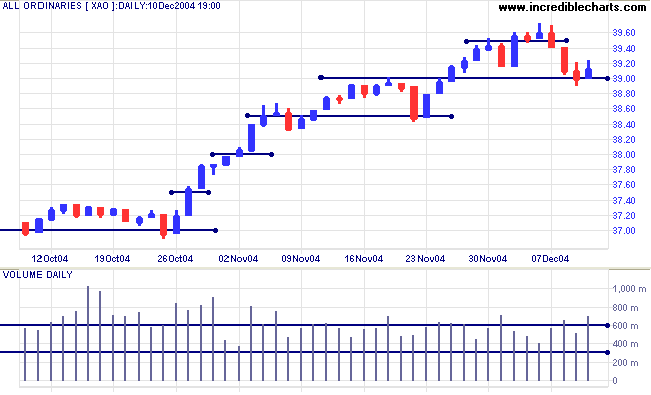
Twiggs Money Flow still signals accumulation.
The primary up-trend is strong. The latest rally is steep and at some stage (perhaps 4000) increased profit-taking will force a correction.
The primary up-trend is strong. The latest rally is steep and at some stage (perhaps 4000) increased profit-taking will force a correction.
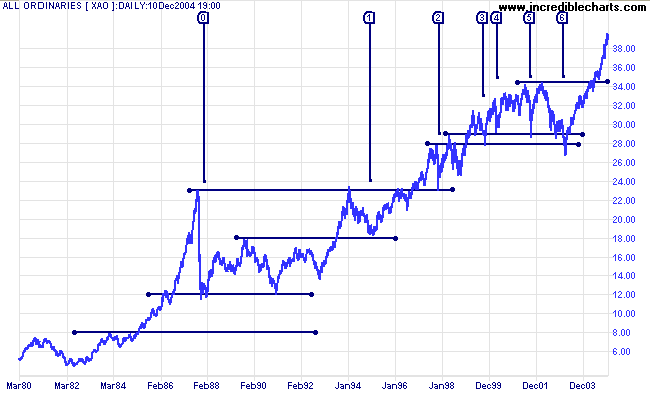
The above chart shows the performance of the All Ords over the
last 25 years. Each major rally has been followed by a
correction, from [1] to [6], back to test support at the
previous highs. The only exception is at [0], October 1987, where
the correction retraced only 75% of earlier gains. However, the
XAO had just spiked from 800 to 2300: almost 200%. There is only
a small chance of a rally of that magnitude; what is far more
likely is that we will see a correction testing support at the
2002 high of 3450 (xjo: 3500).
For further assistance, read About
the Trading Diary.
Colin Twiggs
The less a man knows about the past and the present the more
insecure must be his judgment of the future.
~ Sigmund Freud
~ Sigmund Freud
Back Issues
Access the Trading Diary Archives.

Author: Colin Twiggs is a former investment banker with almost 40 years of experience in financial markets. He co-founded Incredible Charts and writes the popular Trading Diary and Patient Investor newsletters.
Using a top-down approach, Colin identifies key macro trends in the global economy before evaluating selected opportunities using a combination of fundamental and technical analysis.
Focusing on interest rates and financial market liquidity as primary drivers of the economic cycle, he warned of the 2008/2009 and 2020 bear markets well ahead of actual events.
He founded PVT Capital (AFSL No. 546090) in May 2023, which offers investment strategy and advice to wholesale clients.