Trading Diary
June 4, 2005
These extracts from my daily trading diary are
for educational purposes and should not be interpreted as
investment advice. Full terms and conditions can be found at
Terms
of Use.
USA
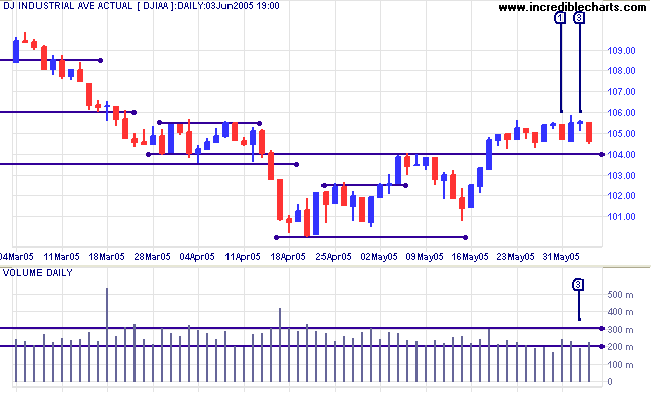
The Dow Industrial Average has consolidated in a narrow range above 10400 over the last two weeks. Volume does not yet give a clear indication of a potential breakout, although higher volume on Tuesday [1] and low volume at [3] could both be said to favor the downside. A close above 10560 would signal a test of resistance at 10900/11000; while a close below 10400 is also a reasonable possibility and would signal a re-test of support at 10000.
The Dow Industrial Average has consolidated in a narrow range above 10400 over the last two weeks. Volume does not yet give a clear indication of a potential breakout, although higher volume on Tuesday [1] and low volume at [3] could both be said to favor the downside. A close above 10560 would signal a test of resistance at 10900/11000; while a close below 10400 is also a reasonable possibility and would signal a re-test of support at 10000.
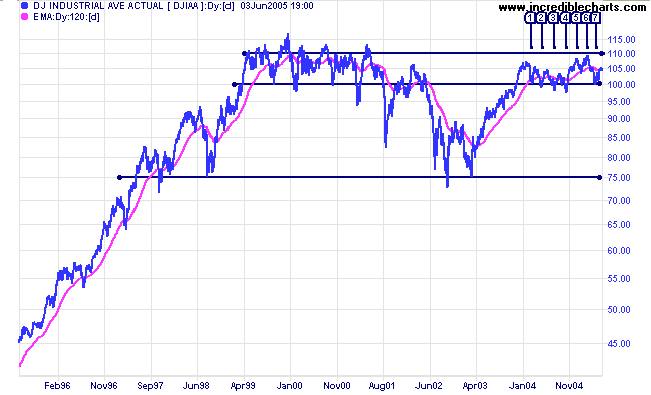
The last year has established strong support at 10000/9750 with
successful tests at [1] through [4] and again at [7]. There is
also strong resistance at 11000/11500, shown by price action from
1999 to 2001 and by recent highs at [5] and [6]. I expect that we
will see a lot more price action between these levels before
there is a clear breakout.
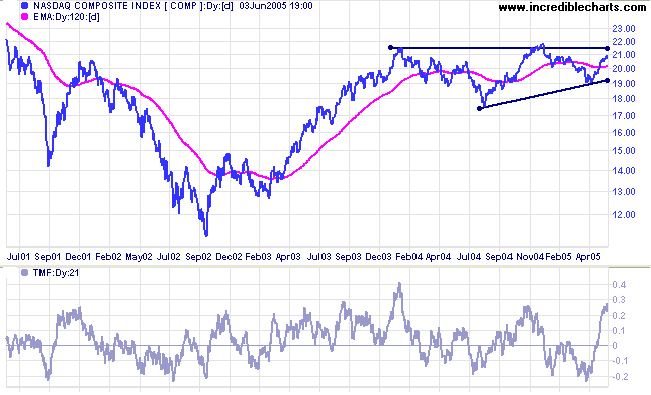
The Nasdaq Composite shows a more bullish
ascending triangle pattern. Some may classify the pattern as
a
rising wedge but I consider the last break above 2150 to be
marginal.
Twiggs Money Flow (21-day) signals active accumulation
(intermediate term). Expect a test of resistance at
2150/2180. A close above 2180 would signal resumption of the
primary up-trend.
If resistance holds, then a re-test of support at 1900 is likely.
If resistance holds, then a re-test of support at 1900 is likely.
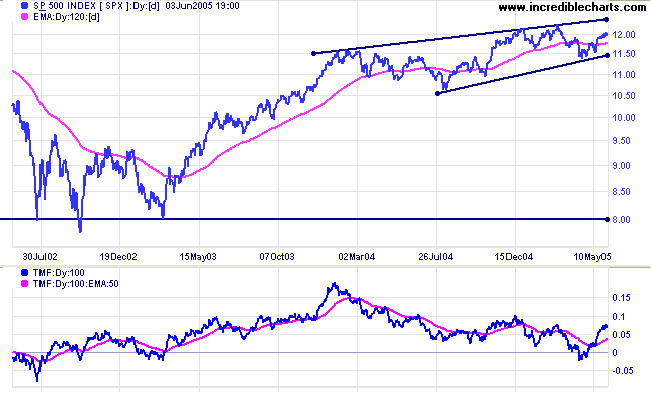
The S&P 500 does not yet show clear direction in the
short-term: the break above 1200 halted after one day and now
appears headed for a re-test of support at 1190. If price
respects 1190 that would be a bullish sign, signaling a test of
resistance at the March high of 1225. A close below 1190 would
herald another visit to 1145/1140.
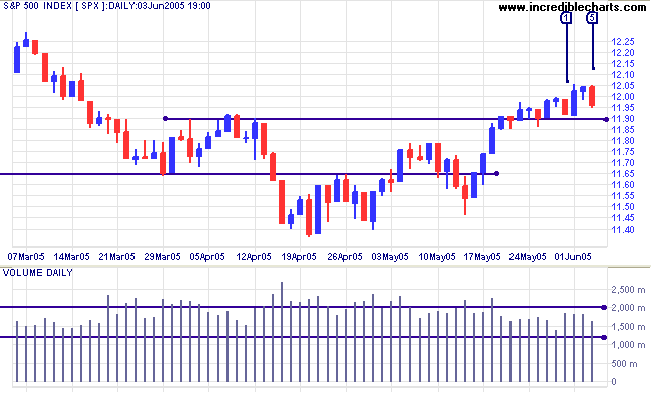
In the long-term the index is wedging upwards in a rough
rising wedge formation. The pattern is meandering rather than
tight (with successive rallies and corrections clearly defining
the borders) but would add increased (bearish) significance to a
break below 1150. The primary trend will reverse upward if there
is a close above 1225 but beware of a marginal breakout that
respects the upper border of the wedge pattern; that would be
another bearish sign.
Twiggs Money Flow (100-day), on the other hand, is rising
strongly and a pull-back that holds above the signal line would
be a strong bull signal.
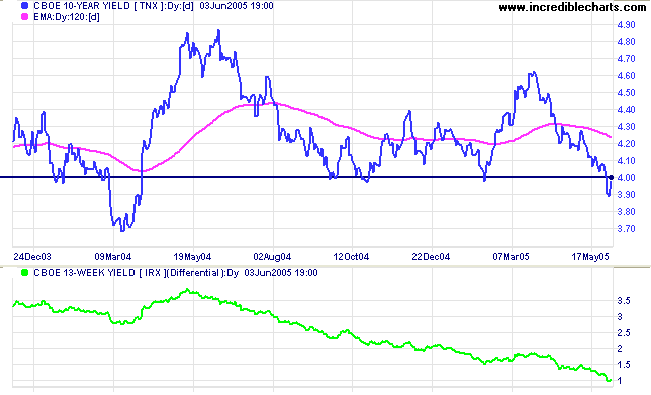
Treasury yields
The yield on 10-year treasury notes fell below support at 4.0%. Friday pulled back to test resistance at the new level. A successful test will signal further weakness, while failure would signal a rally back to 4.5%. T-bills (13-week), on the other hand have climbed to 2.9% and the yield differential (10-year T-notes minus 13-week T-bills) has fallen to 1.0%. Further falls would be a long-term bear signal for equities.
The yield on 10-year treasury notes fell below support at 4.0%. Friday pulled back to test resistance at the new level. A successful test will signal further weakness, while failure would signal a rally back to 4.5%. T-bills (13-week), on the other hand have climbed to 2.9% and the yield differential (10-year T-notes minus 13-week T-bills) has fallen to 1.0%. Further falls would be a long-term bear signal for equities.
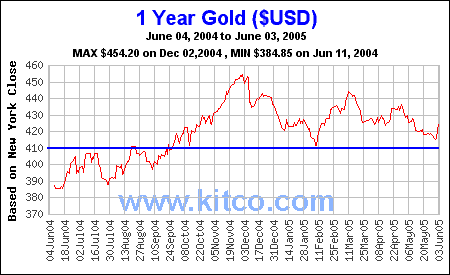
Gold
New York: Spot gold is whipsawing around the $420 level, closing at $423.10 on Friday, in a gradual down-trend.
The primary trend will reverse downward if price falls below support at the February low of $410.
New York: Spot gold is whipsawing around the $420 level, closing at $423.10 on Friday, in a gradual down-trend.
The primary trend will reverse downward if price falls below support at the February low of $410.
ASX Australia
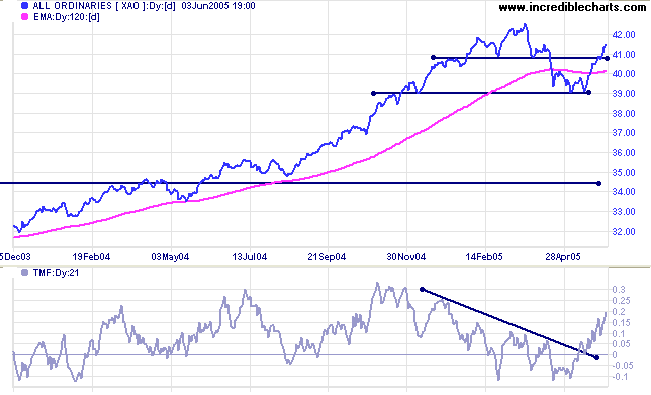
The All Ordinaries is testing resistance at 4140, while the ASX 200 has already broken through and is headed for the March highs. Strong volume and a narrow range at [2] signaled that a strong breakout was to be expected.
The All Ordinaries is testing resistance at 4140, while the ASX 200 has already broken through and is headed for the March highs. Strong volume and a narrow range at [2] signaled that a strong breakout was to be expected.
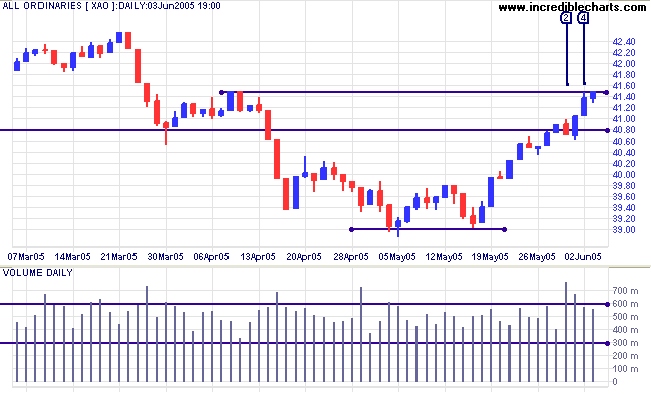
A close above the March highs, preferably by both indices, would
signal resumption of the primary up-trend. Beware, though, of a
marginal break above the highs; that would be a strong bear
signal.
Twiggs Money Flow (21-day) signals strong accumulation in the intermediate term.
If resistance at 4255 holds then expect another test of support at 3900. My warning about 3450 remains. I still see more downside than upside and this could well be a stage 3 top. Failure of support at 3900 would signal that a test of support at 3450 is likely; amounting to roughly a 50% retracement of the previous up-trend. A review of the All Ords over the past 25 years shows that the index regularly cuts back to test support at previous highs.
For further assistance, read About
the Trading Diary.
Colin Twiggs
If we begin with certainties, we shall end in doubts;
but if we begin with doubts, and are patient in them,
we shall end in certainties.
~ Francis Bacon
but if we begin with doubts, and are patient in them,
we shall end in certainties.
~ Francis Bacon
Back Issues
Access the Trading Diary Archives.

Author: Colin Twiggs is a former investment banker with almost 40 years of experience in financial markets. He co-founded Incredible Charts and writes the popular Trading Diary and Patient Investor newsletters.
Using a top-down approach, Colin identifies key macro trends in the global economy before evaluating selected opportunities using a combination of fundamental and technical analysis.
Focusing on interest rates and financial market liquidity as primary drivers of the economic cycle, he warned of the 2008/2009 and 2020 bear markets well ahead of actual events.
He founded PVT Capital (AFSL No. 546090) in May 2023, which offers investment strategy and advice to wholesale clients.