Trading Diary
March 26, 2005
These extracts from my daily trading diary are for educational
purposes and should not be interpreted as investment advice. Full
terms and conditions can be found at Terms
of Use.
USA
The Dow Industrial Average closed below 10600 on Monday [1], signaling an intermediate trend reversal. Market jitters over the looming Fed announcement attracted further sellers on Tuesday before early buyers were signaled by a narrower range and strong volume at [3]. Thursday's consolidation may continue next week, or the index may even pull back to test resistance at 10600, but a test of primary support at 10350 is likely to occur at some point.
I find market jitters in response to gradual rate rises rather bemusing. Their effect is more of a "slow squeeze" than a sudden reversal. Companies continue to post growing earnings until the cumulative effect of rates increases bites into consumer discretionary income and impacts on sales. Banks in particular only start to feel the effect on earnings about 12 to 18 months after a series of rates rises. They may see a drop-off in new business but this has little impact on their bottom line until loan failures belatedly start to rise.
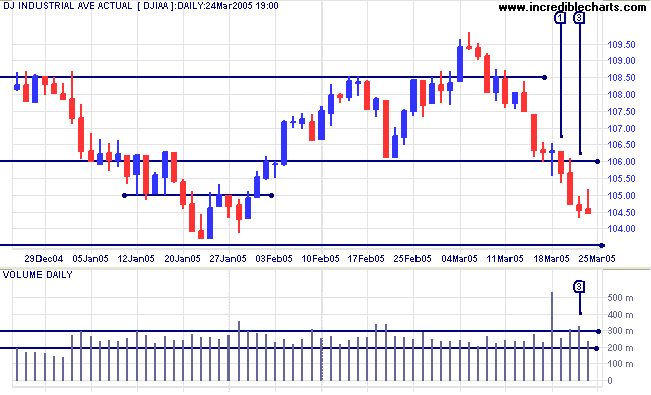
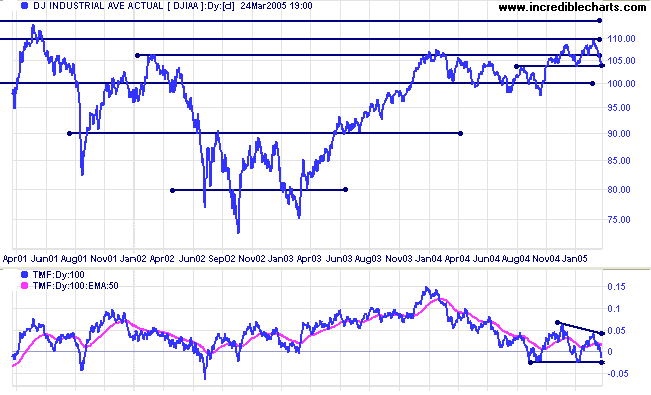
If the index respects support at 10350, we are likely to witness
further consolidation between 11000 and 10350. Expect the primary
up-trend to encounter heavy resistance between 11000 and 11650
(the previous high).
On the other hand, a fall below 10350 would signal a primary trend reversal.
Twiggs Money Flow (100-day) shows a bearish divergence, warning of further consolidation or correction. A fall below the recent months' lows would be a further bear signal (favoring a correction).
On the other hand, a fall below 10350 would signal a primary trend reversal.
Twiggs Money Flow (100-day) shows a bearish divergence, warning of further consolidation or correction. A fall below the recent months' lows would be a further bear signal (favoring a correction).
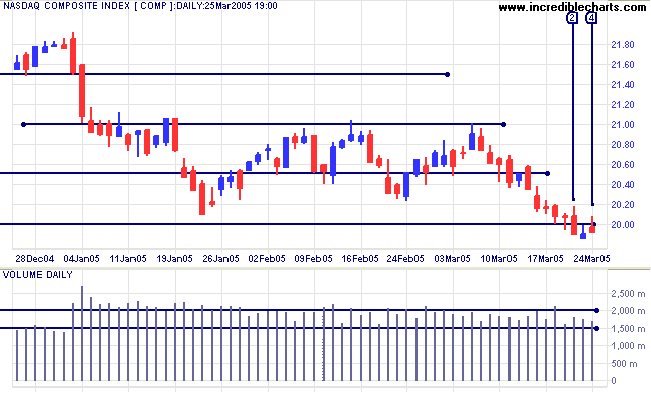
After more than 2 months of consolidation between 2000 and 2100,
the Nasdaq Composite broke through support at [2],
signaling a primary trend reversal. The pull-back over the next
two days failed to hold above the new resistance level, with
Thursday [4] displaying a tall shadow and lighter volume. Expect
the index to test of 1750 unless there is a reversal back above
2000 early next week, when fund managers return to their desks
after the long weekend. If the primary trend on the NASDAQ is
down, the other indexes may be dragged down as well.
Twiggs Money Flow continues below the zero line, signaling that sellers dominate the market.
Twiggs Money Flow continues below the zero line, signaling that sellers dominate the market.
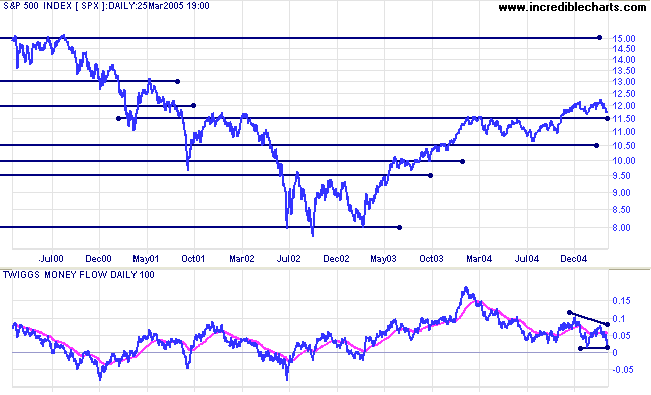
The S&P 500 displayed exceptional volume over the last
week, with market jitters over the Fed and fund managers clearing
their desks before the long weekend. Support at 1185 was broken,
with a strong red candle on Tuesday, before buying support
emerged with a narrow range and even stronger volume at [3].
Sellers are still in control and we can expect a test of primary
support at 1160.
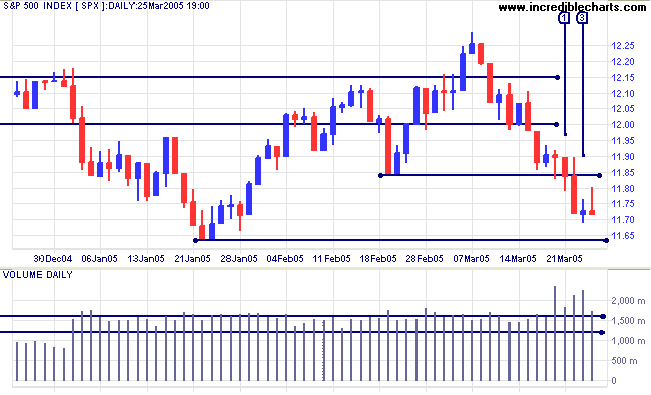
Failure of support at 1160 would signal a primary trend reversal
and a likely test of support at 1050.
Further consolidation between 1225 and 1160 is the most likely outcome; while a rise above 1225 would test resistance at 1300 (and a break through that level would see a test of key resistance at 1500).
Twiggs Money Flow (100-day) displays a bearish divergence. A fall below the previous (January) low would favor a strong correction.
|
|
Treasury yields
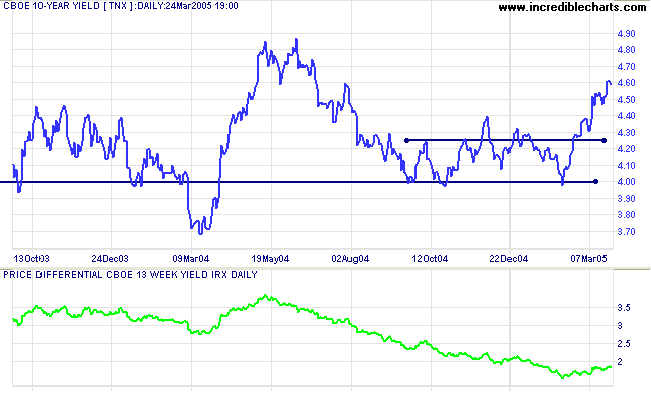
The Federal Reserve did not disappoint, raising rates by another quarter percent while retaining their "measured pace" outlook on future rates rises. They did however indicate that inflationary pressures are rising and hint at future changes to their outlook.
The yield on 10-year treasury notes has risen sharply to around 4.60%.
The yield differential (10-year T-notes minus 13-week T-bills) is trending upwards; a positive sign as yield differentials below 1.0% are considered a long-term bear signal for equity markets.
Gold
New York: Spot gold closed at $425.90 on Friday. The fall below support at $430 signals that the intermediate trend has reversed downwards. Expect a test of primary support at $410.
A fall below $410 would signal that the primary trend has reversed; while another secondary peak below $450 would also be a strong bear signal.
|
ASX Australia
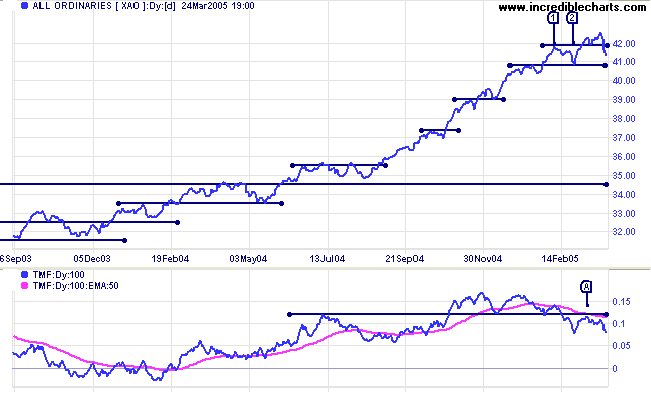
The All Ordinaries upswing on Monday only managed a 25-point gain before speculation over the Fed's next move gave the market the jitters. Selling started on Tuesday with a break below the initial line of support at 4230. This triggered further sales and a break below support at 4180, signaling that the intermediate trend had reversed. Thursday saw momentum slow, with early buyers identified by a smaller bar and strong volume. Expect a test of the primary support level at 4080.
Though not expected, a rise above 4180 in the next few days would be a bull signal for short-term traders.
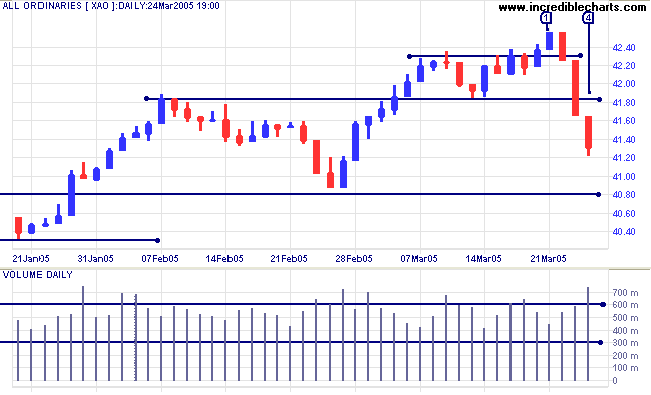
Momentum on the primary up-trend has slowed. A fall below 4080
(not just a surge at the opening) would signal that the primary
trend has reversed.
Twiggs Money Flow (100-day) continues to signal weakness after increased selling into recent rallies. Expect a consolidation or correction.
Twiggs Money Flow (100-day) continues to signal weakness after increased selling into recent rallies. Expect a consolidation or correction.
Weekly reminder:
At some point there is likely to be a correction back to 3450. This is based on observation of the All Ords over the past 25 years, where the index has regularly cut back to test support at previous highs during an up-trend.
At some point there is likely to be a correction back to 3450. This is based on observation of the All Ords over the past 25 years, where the index has regularly cut back to test support at previous highs during an up-trend.
For further assistance, read About
the Trading Diary.
Colin Twiggs
Now this is not the end.
It is not even the beginning of the end.
But it is, perhaps, the end of the beginning.
~ Winston Churchill, November 10, 1942
It is not even the beginning of the end.
But it is, perhaps, the end of the beginning.
~ Winston Churchill, November 10, 1942
Back Issues
Access the Trading Diary Archives.

Author: Colin Twiggs is a former investment banker with almost 40 years of experience in financial markets. He co-founded Incredible Charts and writes the popular Trading Diary and Patient Investor newsletters.
Using a top-down approach, Colin identifies key macro trends in the global economy before evaluating selected opportunities using a combination of fundamental and technical analysis.
Focusing on interest rates and financial market liquidity as primary drivers of the economic cycle, he warned of the 2008/2009 and 2020 bear markets well ahead of actual events.
He founded PVT Capital (AFSL No. 546090) in May 2023, which offers investment strategy and advice to wholesale clients.