Trading Diary
March 19, 2005
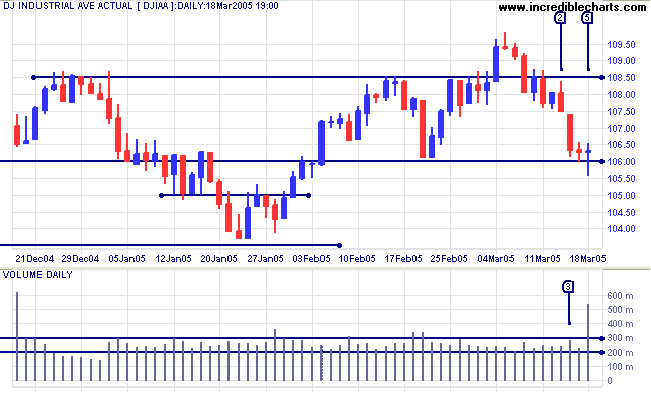
The up-trend on the Dow Industrial Average is not yet dead, with the index holding above support at 10600 on Friday. The massive volume spike is attributable to unusual volatility, caused by the coincidence of:
- triple-witching hour, with futures and options traders closing out their positions; and
- re-weighting of the S$P 500 index, with a negative affect on stocks like Wal-Mart.
Earlier in the week saw a brief test of resistance at [2] before a strong downswing threatened 10600. The strong close on Friday [5] indicates that we can expect a rally to test resistance at 10850. A rise above Friday's high (not just a surge at the opening) would confirm this.
A rise above 10850 would be a longer-term bull signal; while a fall below 10600 would indicate primary trend weakness. A break below the January low of 10368 would signal that the trend has reversed.
Twiggs Money Flow (100-day) is whipsawing around the signal line, showing uncertainty.
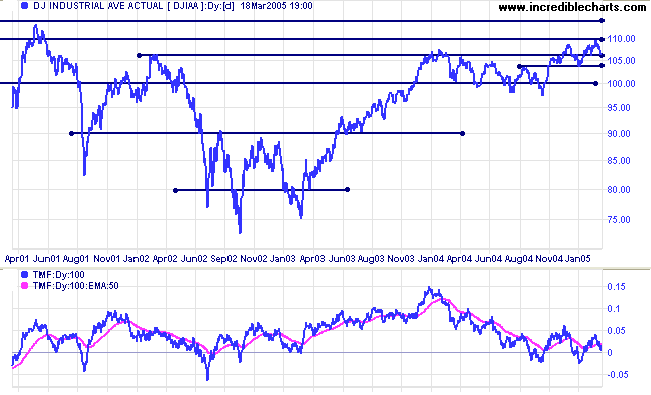
Twiggs Money Flow continues to lurk below the zero line, indicating that sellers dominate the market.
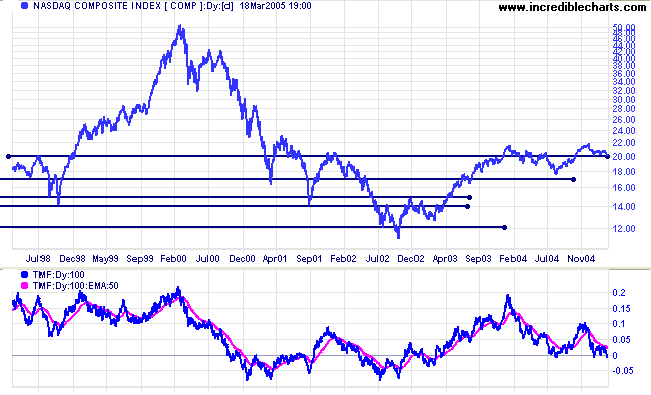
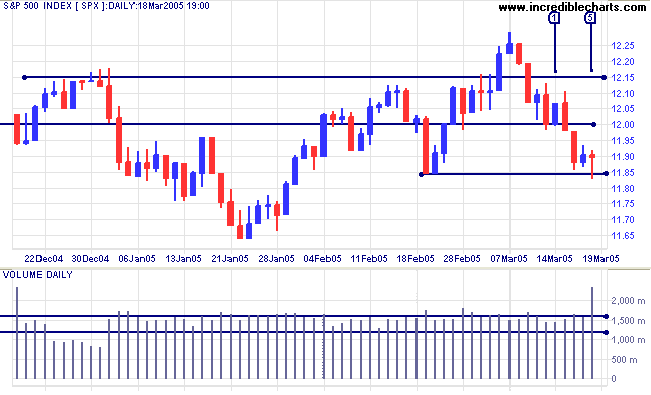
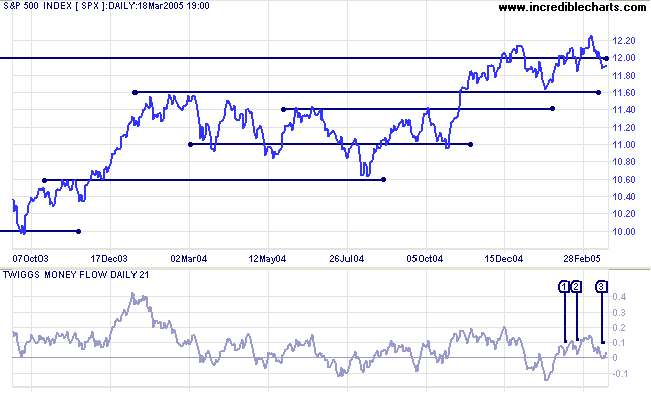
Twiggs Money Flow (21-day) completed another bullish trough at [3], signaling accumulation.
|
|
The Federal Reserve meets on March 22nd and rates are almost certain to rise by another quarter per cent. More significant will be whether the Fed drops the word "measured" from its outlook on future rates rises, introducing increased uncertainty.
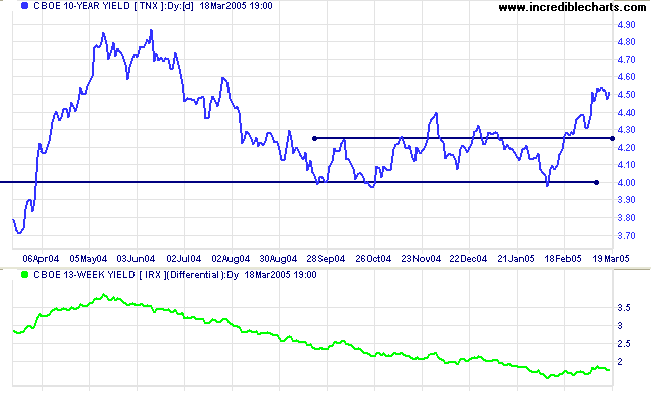
The yield on 10-year treasury notes is consolidating around 4.50%.
The yield differential (10-year T-notes minus 13-week T-bills) has recovered to above 1.7%. A positive sign. Yield differentials below 1.0% are a long-term bear signal for equity markets.
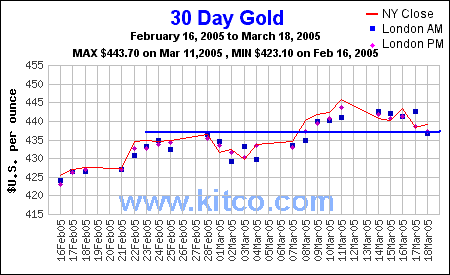
New York: Spot gold has retraced to test initial support in the intermediate up-trend, closing at $438.80 on Friday.
If price respects this level, that would be a bullish sign. Failure would signal a re-test of the more significant $430 support level and a slowing of the up-trend.
|
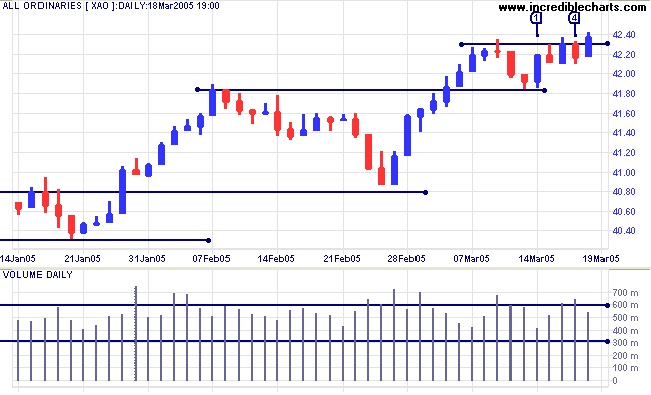
The All Ordinaries respected initial support at 4180, rallying above 4200 (the high from the previous Friday) on Monday [1], albeit on light volume. This signals that the bull run is likely to continue. Tuesday, Wednesday and Thursday encountered stubborn resistance at the early March high of 4230, with strong volume at [3] and [4] before Friday's breakout. Expect an intermediate rally of around 50 points (4230 - 4180).
A reversal below 4230 (other than just a surge at the opening) would signal that momentum is slowing; while a fall below 4180 would signal trend weakness and a likely test of support at 4080.
Twiggs Money Flow (100-day) continues to signal weakness, with increased selling into recent rallies. Expect momentum to slow and some form of consolidation or correction.
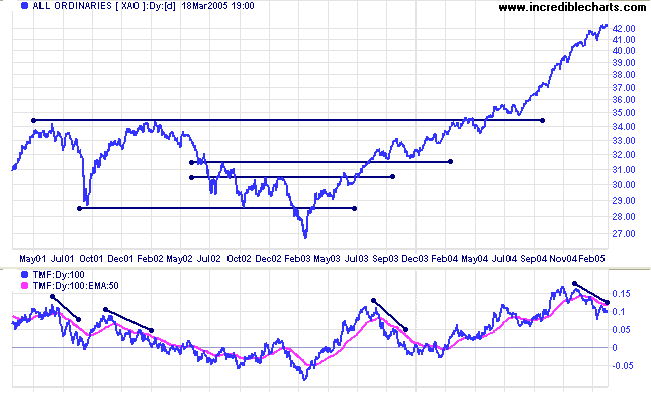
At some point there is likely to be a correction back to 3450. This is based on observation of the All Ords over the past 25 years, where the index has regularly cut back to test support at previous highs during an up-trend. This as a reminder not to get carried away with the bull market and to stay alert for signs of a reversal.
All professional philosophers tend to assume that common sense
means the mental habit of the common man.
Nothing could be further from the mark. The common man is
chiefly to be distinguished
by his plentiful lack of common sense: he believes things
on evidence that is too scanty,
or that distorts the plain facts, or that is full of non
sequiturs.
Common sense really involves making full use of all the
demonstrable evidence
-- and of nothing but the demonstrable evidence.
~ H L Mencken
Back Issues

Author: Colin Twiggs is a former investment banker with almost 40 years of experience in financial markets. He co-founded Incredible Charts and writes the popular Trading Diary and Patient Investor newsletters.
Using a top-down approach, Colin identifies key macro trends in the global economy before evaluating selected opportunities using a combination of fundamental and technical analysis.
Focusing on interest rates and financial market liquidity as primary drivers of the economic cycle, he warned of the 2008/2009 and 2020 bear markets well ahead of actual events.
He founded PVT Capital (AFSL No. 546090) in May 2023, which offers investment strategy and advice to wholesale clients.
