Trading Diary
March 12, 2005
These extracts from my daily trading diary are for educational
purposes and should not be interpreted as investment advice. Full
terms and conditions can be found at Terms
of Use.
USA
The pull-back on the Dow Industrial Average failed to respect support at 10850. A tall shadow and moderate volume on Monday [1] signaled that buyers had lost interest; confirmed by Tuesday's narrow range and low volume. Sellers appeared on Wednesday [3] with a tall red candle and higher volume, breaking through initial support at 10850 (from the December high). Thursday marked a brief resurgence, attempting to break back above the support line, but this failed with a further fall on Friday [5] on average volume.
Expect the latest downswing to test support at 10600. A fall below that level would signal primary trend weakness; while a fall below the January low of 10368 would signal that the trend has reversed.
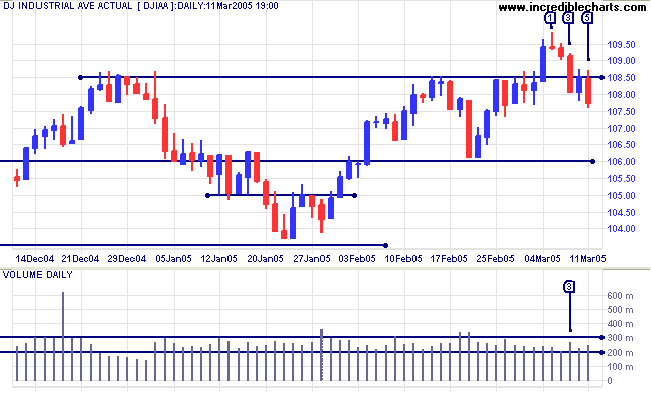
The primary up-trend is likely to encounter heavy resistance
between 11000 and 11650 (the previous high).
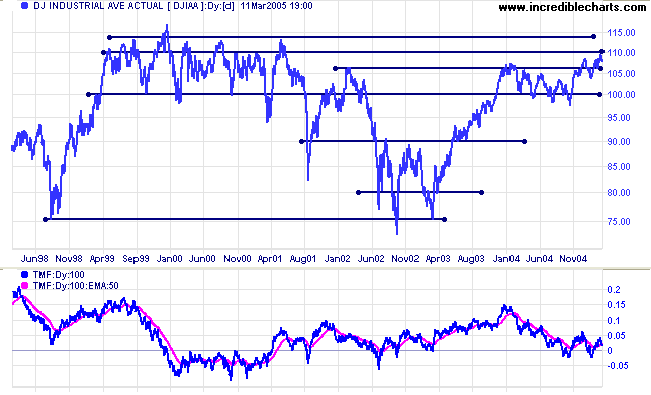
Twiggs Money Flow (100-day) has slipped back below the signal line. The index remains uncertain, forming a lower peak than the last one in December.
Twiggs Money Flow (100-day) has slipped back below the signal line. The index remains uncertain, forming a lower peak than the last one in December.
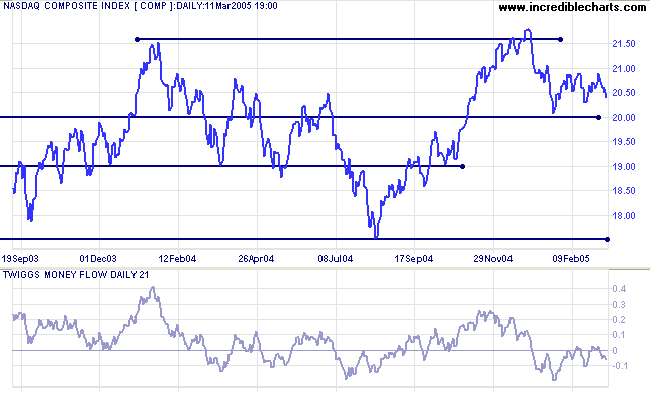
The Nasdaq Composite is weaker than the Dow and S&P
500. Having failed to break through resistance at 2100, the index
is headed for another test of support at 2000. A fall below 2000
would signal that a test of support at 1750 is likely.
A break above 2100 would be bullish, signaling
another test of resistance at 2150.
Twiggs Money Flow continues to lurk below the zero line,
indicating that sellers dominate the market.
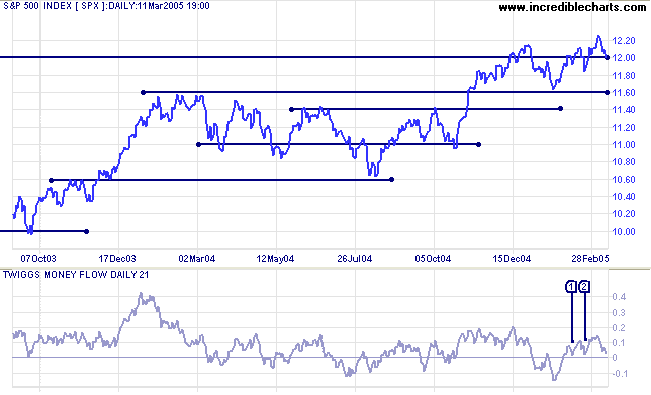
The pull-back on the S&P 500 failed
to respect support at 1215. After encountering resistance
on Monday at [1] the index fell sharply to test support at 1200.
Thursday showed some buying support before another red candle on
Friday [5].
A rise above 1215, without breaking the 1200 support level, would signal that the up-trend is still healthy. On the other hand, a fall below 1200 would signal that the trend is losing momentum and a test of 1160 can be expected.
A rise above 1215, without breaking the 1200 support level, would signal that the up-trend is still healthy. On the other hand, a fall below 1200 would signal that the trend is losing momentum and a test of 1160 can be expected.
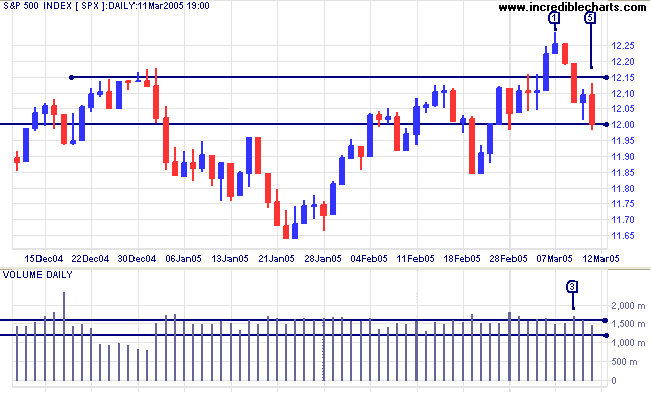
In the long-term, the next level of resistance is at 1300. If the
index breaks through this level, we should see a test of the key
resistance level at 1500. A fall below support at 1150/1160
would signal that the primary trend has reversed.
Twiggs Money Flow (21-day) remains above zero after bullish troughs at [1] and [2]. A fall below zero would be bearish; while another trough above the zero line would be a strong bull signal.
Twiggs Money Flow (21-day) remains above zero after bullish troughs at [1] and [2]. A fall below zero would be bearish; while another trough above the zero line would be a strong bull signal.
|
|
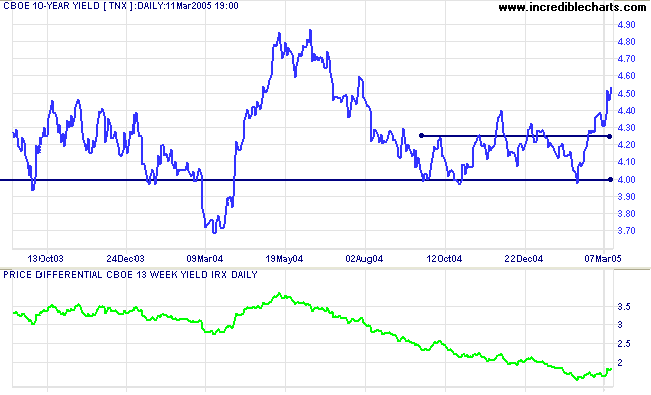
Treasury yields
The yield on 10-year treasury notes is testing resistance at 4.50%.
The yield differential (10-year T-notes minus 13-week T-bills) has started to recover. A positive sign. Yield differentials below 1.0% are a long-term bear signal for equity markets.
The yield on 10-year treasury notes is testing resistance at 4.50%.
The yield differential (10-year T-notes minus 13-week T-bills) has started to recover. A positive sign. Yield differentials below 1.0% are a long-term bear signal for equity markets.
Gold
New York: After testing support at $430, last week, spot gold has rallied to close at $445.50 on Friday.
Expect a test of resistance at $450.
New York: After testing support at $430, last week, spot gold has rallied to close at $445.50 on Friday.
Expect a test of resistance at $450.
|
ASX Australia
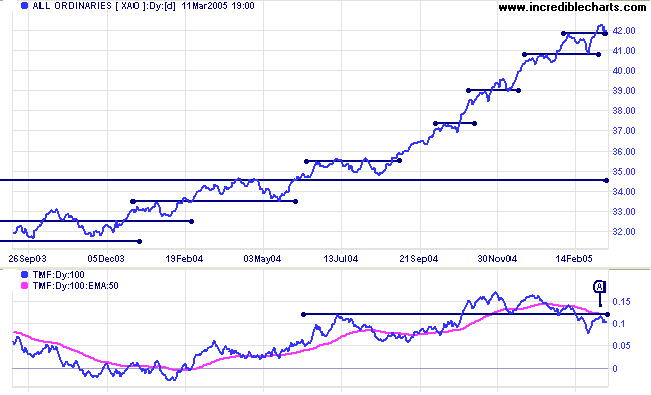
Increased selling has been evident on the All Ordinaries, with longer shadows and lighter volume since the last rally broke above 4160. The index encountered resistance at [2] with an inside day on higher volume; followed by a tall doji candle at [3] accompanied by even stronger volume. The downswing started with a strong red candle but soon encountered support from the intermediate high in February, at 4183. Friday shows buying support, with a shorter bar and longer tail at [5], while volume remains strong.
A rally above 4200 (not just a surge at the opening) would signal that the downswing has respected initial support and is likely to take out the high of [3]: a sign that the bull rally will continue. A fall below 4183 (other than just a surge at the opening) would signal that momentum is slowing; while a fall below 4160 (which also represents a retracement >50%) would signal trend weakness.
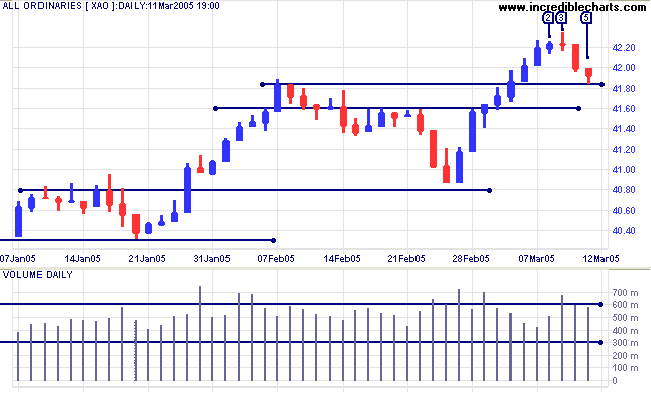
The primary trend is strong, with little/no overlap between
troughs and previous peaks since August last year. The last,
stronger correction back to 4080 is a sign that momentum may be
slowing.
Twiggs Money Flow (100-day) continues to signal weakness, warning of increased selling into recent rallies. The peak [A] below the signal line warns of continued distribution.
Twiggs Money Flow (100-day) continues to signal weakness, warning of increased selling into recent rallies. The peak [A] below the signal line warns of continued distribution.
Weekly reminder:
At some point there is likely to be a correction back to 3450. This is based on observation of the All Ords over the past 25 years, where the index has regularly cut back to test support at previous highs during an up-trend. This as a reminder not to get carried away with the bull market and to stay alert for signs of a reversal.
At some point there is likely to be a correction back to 3450. This is based on observation of the All Ords over the past 25 years, where the index has regularly cut back to test support at previous highs during an up-trend. This as a reminder not to get carried away with the bull market and to stay alert for signs of a reversal.
For further assistance, read About
the Trading Diary.
Colin Twiggs
In times of change, learners inherit the earth;
while the learned find themselves beautifully equipped
to work in a world that no longer exists.
~ Eric Hoffer
while the learned find themselves beautifully equipped
to work in a world that no longer exists.
~ Eric Hoffer
Back Issues
Access the Trading Diary Archives.

Author: Colin Twiggs is a former investment banker with almost 40 years of experience in financial markets. He co-founded Incredible Charts and writes the popular Trading Diary and Patient Investor newsletters.
Using a top-down approach, Colin identifies key macro trends in the global economy before evaluating selected opportunities using a combination of fundamental and technical analysis.
Focusing on interest rates and financial market liquidity as primary drivers of the economic cycle, he warned of the 2008/2009 and 2020 bear markets well ahead of actual events.
He founded PVT Capital (AFSL No. 546090) in May 2023, which offers investment strategy and advice to wholesale clients.