Trading Diary
February 19, 2005
These extracts from my daily trading diary are for educational
purposes and should not be interpreted as investment advice. Full
terms and conditions can be found at Terms
of Use.
USA
The Dow Industrial Average respected resistance at 10850 to 10860, with a strong red candle on Thursday. However, Friday shows buying support at 10750 with strong volume and a close near the high. A rise above Friday's high would signal another attempt at resistance at 10850 to 10860. A break through resistance would be a strong bull signal. A fall below the low of February 9 would signal that a re-test of support at 10350 is likely.
The Dow Industrial Average respected resistance at 10850 to 10860, with a strong red candle on Thursday. However, Friday shows buying support at 10750 with strong volume and a close near the high. A rise above Friday's high would signal another attempt at resistance at 10850 to 10860. A break through resistance would be a strong bull signal. A fall below the low of February 9 would signal that a re-test of support at 10350 is likely.
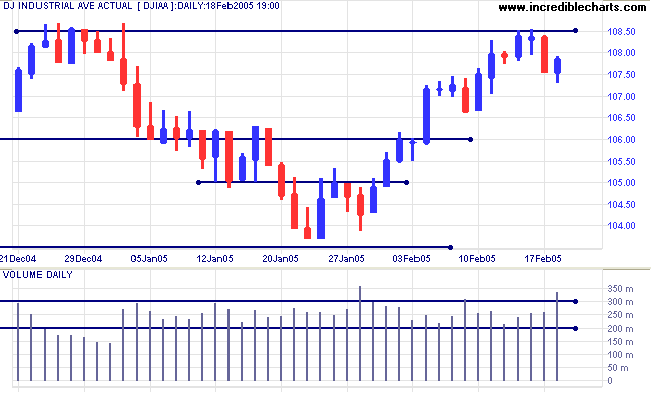
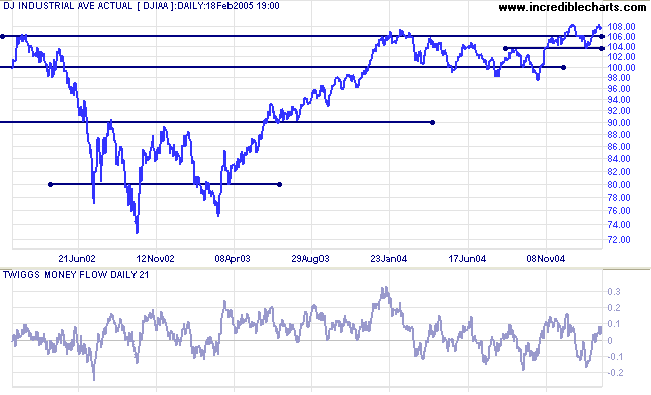
If price breaks above 10860, expect a test of resistance at
11400.
Twiggs Money Flow (21-day) is above the zero line, but the longer term trend is lower and it is too early to call this a recovery.
Twiggs Money Flow (21-day) is above the zero line, but the longer term trend is lower and it is too early to call this a recovery.
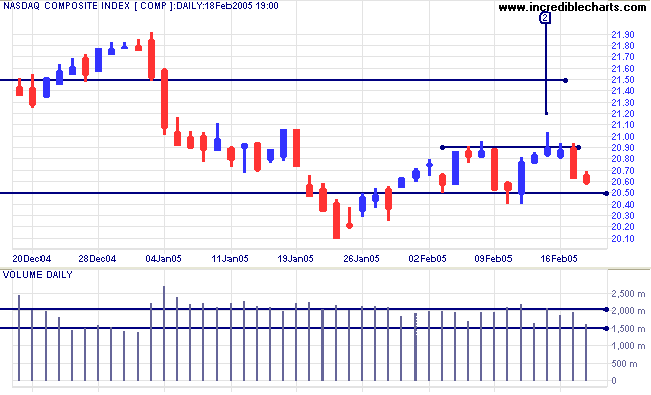
The Nasdaq Composite is headed for a third test of support
at 2050 after encountering committed resistance at 2050. Note the
long shadow and higher volume at [2]. A close below 2050 (or fall
below 2040) would signal a test of support at 2000. A fall below
2000 would be a (long-term) bear signal.
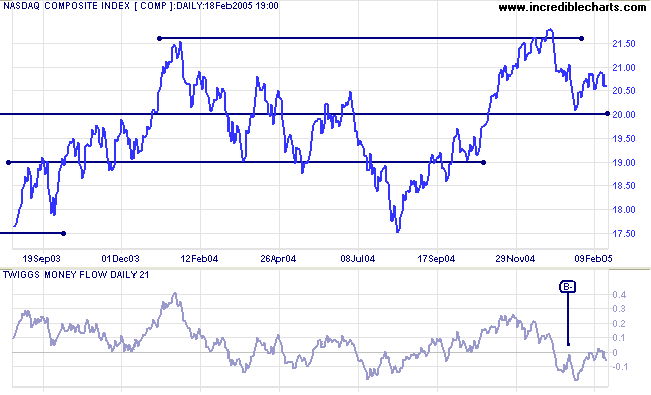
Twiggs Money Flow (21-day) appears weaker than the Dow and
SPX: still hovering below the zero line.
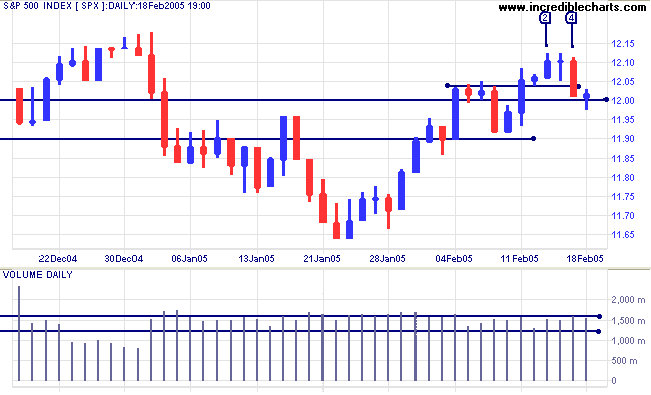
The S&P 500 resembles the Dow with a strong red candle
on Thursday [4], in this case testing support at 1200. Friday
showed buying support with a long tail and a close back above
1200. If the index now rallies to above the high of [2] that
would be a strong bull signal. A fall below 1160, though less
likely, would indicate further consolidation.
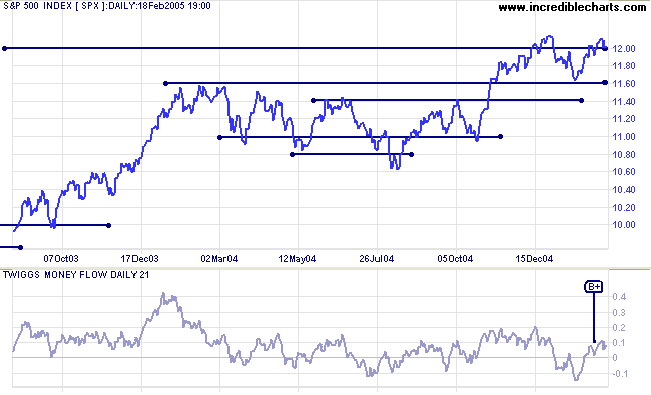
Further troughs above zero, like the one below at [B+], would be
a bullish sign on
Twiggs Money Flow.
|
|
Treasury yields
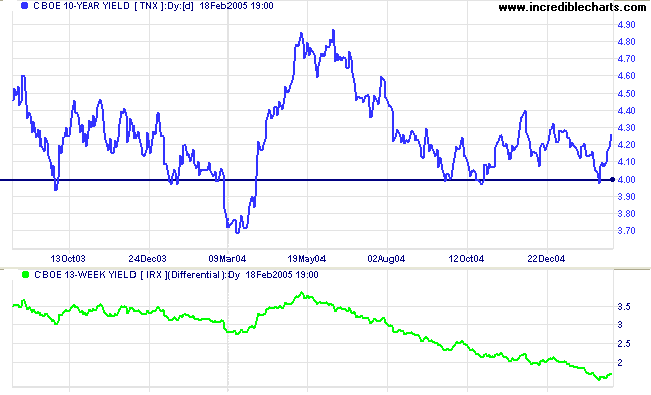
The yield on 10-year treasury notes jumped after a sharp increase in the January core producer price index re-ignited fears of inflation and consequent steeper rates increases from the Fed.
The yield differential (10-year T-notes minus 13-week T-bills) increased to 1.70% this week. Below 1.0% would be a (long-term) bear signal for equity markets.
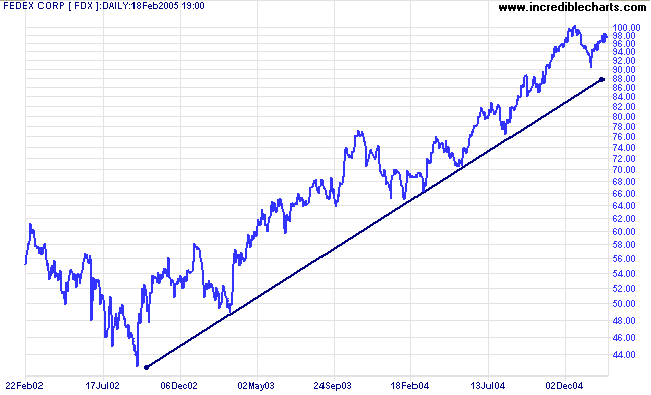
Parcel delivery services like Fedex [FDX_NY] are a good
indicator of the level of underlying economic activity, giving an
idea why producer prices have started to rise.
Gold
New York: Spot gold has broken through resistance at $420, the base of the recent consolidation, with Friday closing at $427.30.
The (intermediate) down-trend has slowed and further consolidation below $430 is likely. A rise above $430 would signal a test of resistance at $450.
New York: Spot gold has broken through resistance at $420, the base of the recent consolidation, with Friday closing at $427.30.
The (intermediate) down-trend has slowed and further consolidation below $430 is likely. A rise above $430 would signal a test of resistance at $450.
|
ASX Australia
The All Ordinaries has retreated from its February 7 high. An attempted rally at [1] quickly reversed due to a lack of buying support, with support later evident at 4130. A weak close at [3] indicated selling pressure, before a brief consolidation with inside days at [4] and [5]. A rise above the high of [3] would signal another test of the February 7 high, while a fall below support at 4130 would signal that a test of support at 4030 is likely.
The All Ordinaries has retreated from its February 7 high. An attempted rally at [1] quickly reversed due to a lack of buying support, with support later evident at 4130. A weak close at [3] indicated selling pressure, before a brief consolidation with inside days at [4] and [5]. A rise above the high of [3] would signal another test of the February 7 high, while a fall below support at 4130 would signal that a test of support at 4030 is likely.
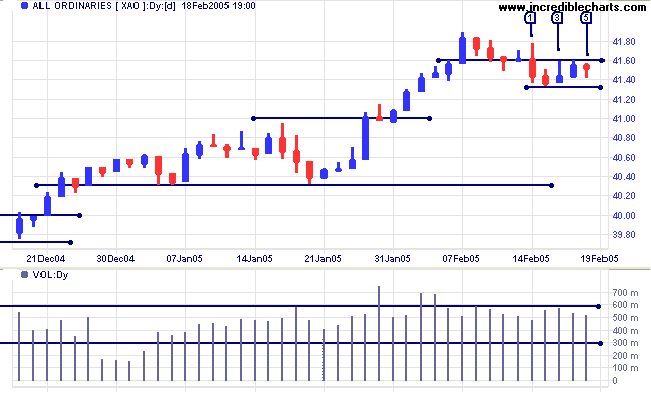
Twiggs Money Flow continues to decline, signaling that the
up-trend is weakening. A fall below below zero on 21-day TMF
would add further confirmation.
My weekly reminder:
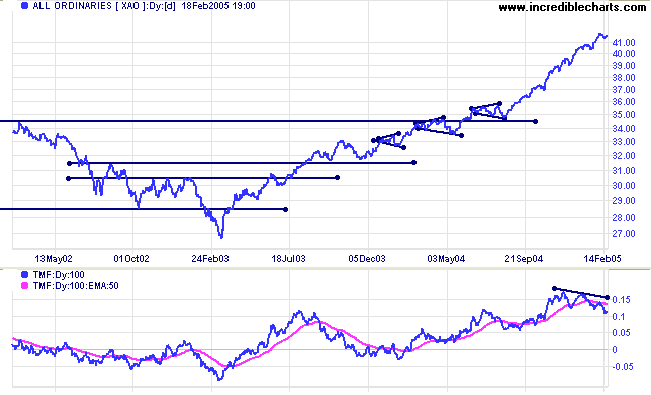
We need to bear in mind that at some point there is likely to be a correction back to 3450. This is based on observation of the All Ords over the past 25 years, where the index has regularly tested support at previous highs during an up-trend.
We need to bear in mind that at some point there is likely to be a correction back to 3450. This is based on observation of the All Ords over the past 25 years, where the index has regularly tested support at previous highs during an up-trend.
For further assistance, read About
the Trading Diary.
Colin Twiggs
Your emotions are often a reverse indicator
of what you ought to be doing.
~ John F. Hindelong
of what you ought to be doing.
~ John F. Hindelong
Back Issues
Access the Trading Diary Archives.

Author: Colin Twiggs is a former investment banker with almost 40 years of experience in financial markets. He co-founded Incredible Charts and writes the popular Trading Diary and Patient Investor newsletters.
Using a top-down approach, Colin identifies key macro trends in the global economy before evaluating selected opportunities using a combination of fundamental and technical analysis.
Focusing on interest rates and financial market liquidity as primary drivers of the economic cycle, he warned of the 2008/2009 and 2020 bear markets well ahead of actual events.
He founded PVT Capital (AFSL No. 546090) in May 2023, which offers investment strategy and advice to wholesale clients.