Trading Diary
February 12, 2005
These extracts from my daily trading diary are for educational
purposes and should not be interpreted as investment advice. Full
terms and conditions can be found at Terms
of Use.
USA
The Dow Industrial Average staged a brief correction, starting with consolidation at [1] and ending with a downswing at [3]. This quickly expired, with a strong blue candle on Thursday and further gains on Friday [5]. The tall shadow at [5] forewarns of further resistance at 10850 to 10860. Expect some consolidation at this level before an attempted breakout. A close above 10860 will be a strong bull signal. A fall below the low of [3] would signal an intermediate reversal and a re-test of support at 10350.
The Dow Industrial Average staged a brief correction, starting with consolidation at [1] and ending with a downswing at [3]. This quickly expired, with a strong blue candle on Thursday and further gains on Friday [5]. The tall shadow at [5] forewarns of further resistance at 10850 to 10860. Expect some consolidation at this level before an attempted breakout. A close above 10860 will be a strong bull signal. A fall below the low of [3] would signal an intermediate reversal and a re-test of support at 10350.
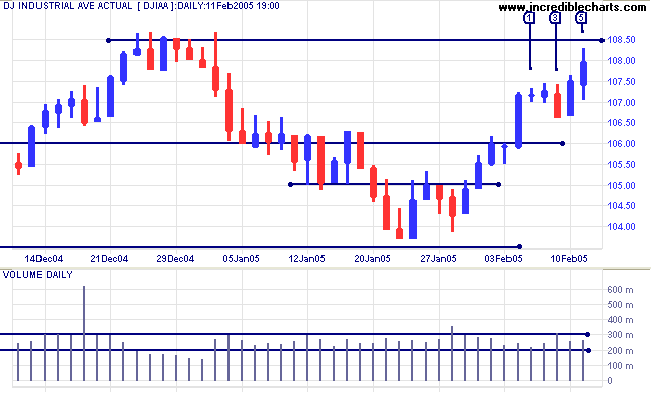
If price breaks above 10860 for more than a day, expect a rally
to test resistance at 11400.
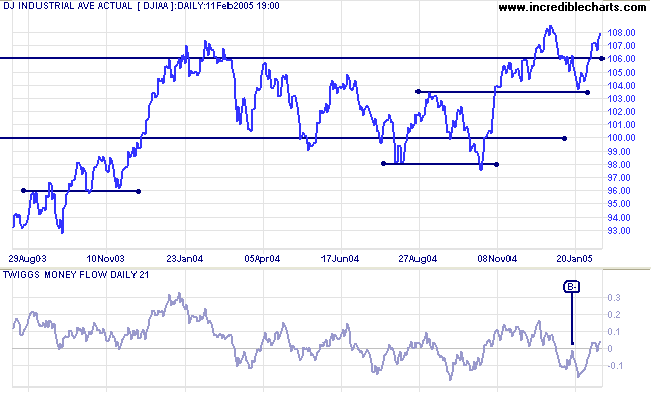
Twiggs Money Flow (21-day) has crossed above the zero line, signaling accumulation. It is too early to call this a recovery but watch for further signs in the week ahead.
Twiggs Money Flow (21-day) has crossed above the zero line, signaling accumulation. It is too early to call this a recovery but watch for further signs in the week ahead.
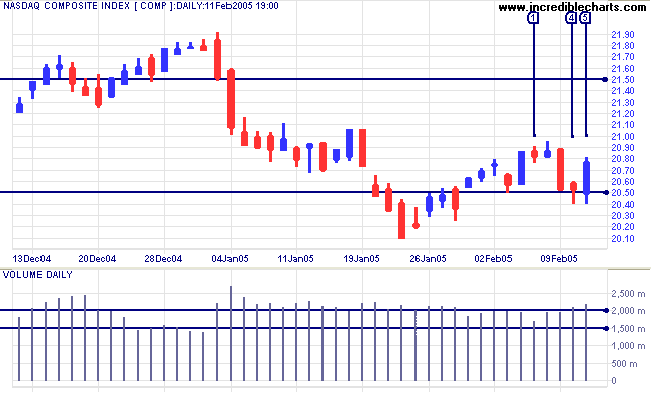
The Nasdaq Composite again tested support at 2050. The
week started with consolidation at [1] before a sharp fall on
Wednesday. Increased volume and long tails at [4] and [5] signal
buying support. A rise above 2095 would be a bullish sign, while
a close below 2050 would be bearish.
Watch for Twiggs Money Flow (21-day) to cross above the zero line.
Watch for Twiggs Money Flow (21-day) to cross above the zero line.
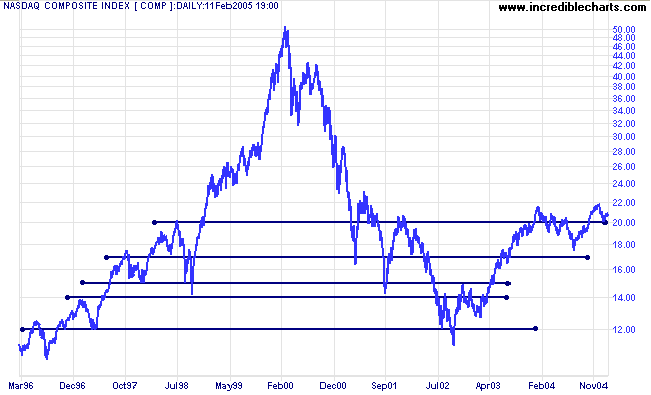
Never underestimate the importance of round numbers when
interpreting support/resistance. The monthly chart below
highlights the key support level of 2000. If the index holds
above that level, a strong bull trend is likely to develop.
The S&P 500 has rallied above support at 1160 and now
penetrated resistance at 1200. A pull-back that respects support
at 1200 would be a strong bull signal. On the other hand, a fall
below 1160 would indicate that further consolidation can be
expected.
Twiggs Money Flow has formed a trough [B+] above the zero line: a bullish sign.
Twiggs Money Flow has formed a trough [B+] above the zero line: a bullish sign.
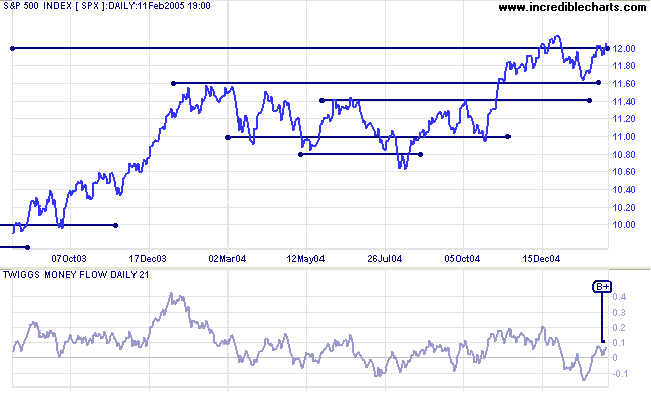
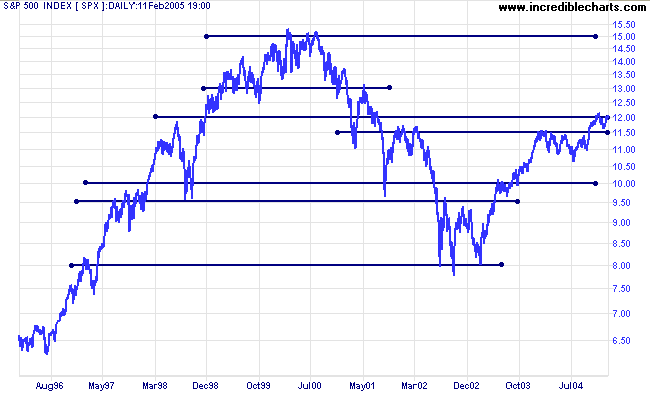
The primary up-trend is strong. Expect some resistance at 1300,
with major resistance around 1500.
|
|
Treasury yields
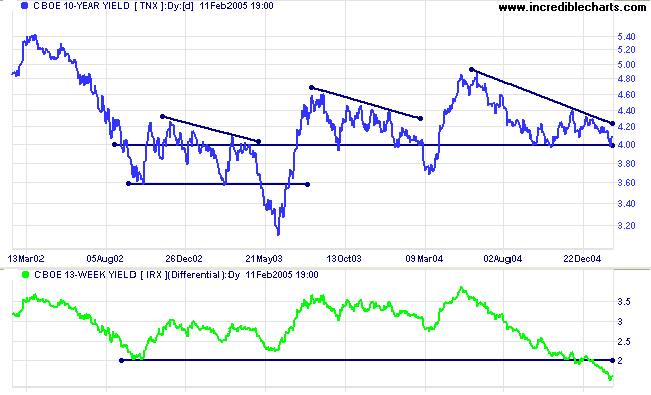
Market fears of a steep rates rise appear to have eased and the yield on 10-year treasury notes completed another test of support at 4.00%. Yields appear soft and a fall below 4.0% would be bearish for equities.
The yield differential (10-year T-notes minus 13-week T-bills) continues to fall, reaching 1.60% this week. Below 1.0% would be a (long-term) bear signal for equity markets.
Gold
New York: Spot gold has rallied to test resistance at the base of the recent consolidation, closing up at $420.40 on Friday.
A successful test will signal that a fall to $400 (and possibly the 1-year low of $375) can be expected.
Reversal back above $420 would signal that the (intermediate) down-trend has slowed and further consolidation is likely.
|
ASX Australia
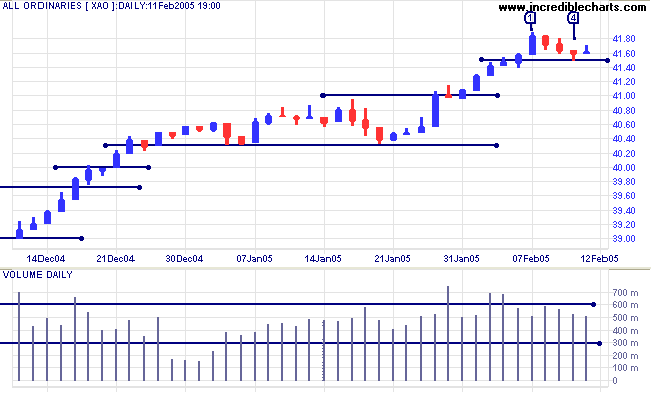
The bull rally on the All Ordinaries continues. After a brief consolidation, towards the end of last week, the index rallied strongly on Monday at [1]. The modest correction that follows, ending with declining volume and a long tail at [4], indicates that the (intermediate) up-trend is likely to continue. Though Friday's weak close warns that selling pressure has not completely dissipated.
A rise above Friday's high would signal trend continuation, while a fall below support at 4150 would signal that the trend has reversed.
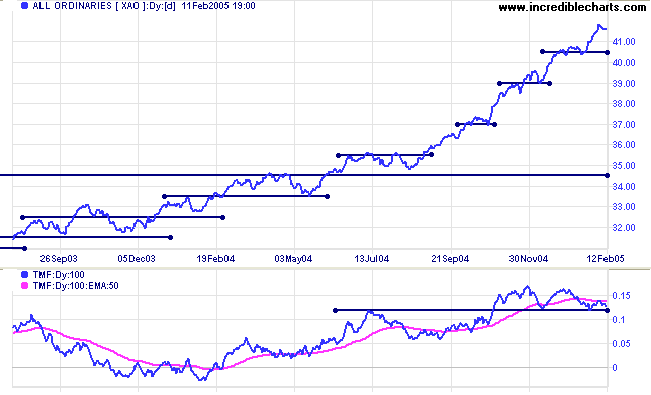
Twiggs Money Flow is bearish, with the 100-day indicator
peaking below the signal line. A fall below the previous low at
0.12 would confirm the signal; as would a fall below zero on
21-day TMF.
I repeat this paragraph each week as a reminder; as much to
myself as to others:
The primary trend still appears strong but we need to bear in mind that at some point there is likely to be a correction back to 3450. This is based on observation of the All Ords over the past 25 years, where the index has regularly tested support at previous highs in an up-trend.
The primary trend still appears strong but we need to bear in mind that at some point there is likely to be a correction back to 3450. This is based on observation of the All Ords over the past 25 years, where the index has regularly tested support at previous highs in an up-trend.
For further assistance, read About
the Trading Diary.
Colin Twiggs
You are what your deep, driving desire is.
As your desire is, so is your will.
As your will is, so is your deed.
As your deed is, so is your destiny.
~ Brihadaranyaka Upanishad IV.4.5
As your desire is, so is your will.
As your will is, so is your deed.
As your deed is, so is your destiny.
~ Brihadaranyaka Upanishad IV.4.5
Back Issues
Access the Trading Diary Archives.

Author: Colin Twiggs is a former investment banker with almost 40 years of experience in financial markets. He co-founded Incredible Charts and writes the popular Trading Diary and Patient Investor newsletters.
Using a top-down approach, Colin identifies key macro trends in the global economy before evaluating selected opportunities using a combination of fundamental and technical analysis.
Focusing on interest rates and financial market liquidity as primary drivers of the economic cycle, he warned of the 2008/2009 and 2020 bear markets well ahead of actual events.
He founded PVT Capital (AFSL No. 546090) in May 2023, which offers investment strategy and advice to wholesale clients.