Trading Diary
January 29, 2005
These extracts from my daily trading diary are for educational
purposes and should not be interpreted as investment advice. Full
terms and conditions can be found at Terms
of Use.
USA
The Dow Industrial Average encountered resistance at 10500 after a short upswing, candles [2] and [3] displaying long shadows. This led me to believe that a strong down-trend would follow, but Thursday and Friday [5] both have long tails, reflecting buying support. Strong volume on Friday indicates a volatile market and we may witness a sharp move in either direction.
The Dow Industrial Average encountered resistance at 10500 after a short upswing, candles [2] and [3] displaying long shadows. This led me to believe that a strong down-trend would follow, but Thursday and Friday [5] both have long tails, reflecting buying support. Strong volume on Friday indicates a volatile market and we may witness a sharp move in either direction.
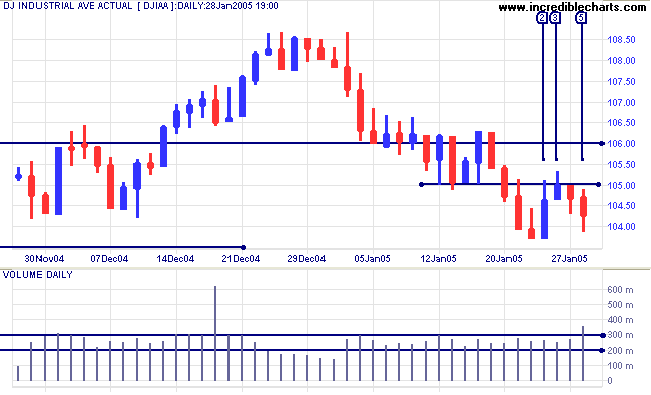
So far the index has held above the first line of support at
10350 (from the previous high in September). Failure to breach
this level would be a strong bull signal.
If the index holds above 10000, that would still be moderately bullish and further attempts to break above resistance at 10600 are likely. If the correction reaches the previous low of 9750, on the other hand, that would signal bear strength: expect a change in the primary trend.
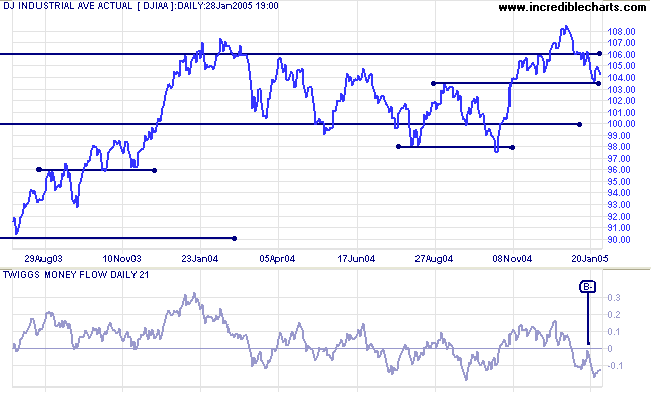
Twiggs Money Flow (21-day) continues to signal distribution after the peak below zero at [B-] (a strong bear signal).
If the index holds above 10000, that would still be moderately bullish and further attempts to break above resistance at 10600 are likely. If the correction reaches the previous low of 9750, on the other hand, that would signal bear strength: expect a change in the primary trend.
Twiggs Money Flow (21-day) continues to signal distribution after the peak below zero at [B-] (a strong bear signal).
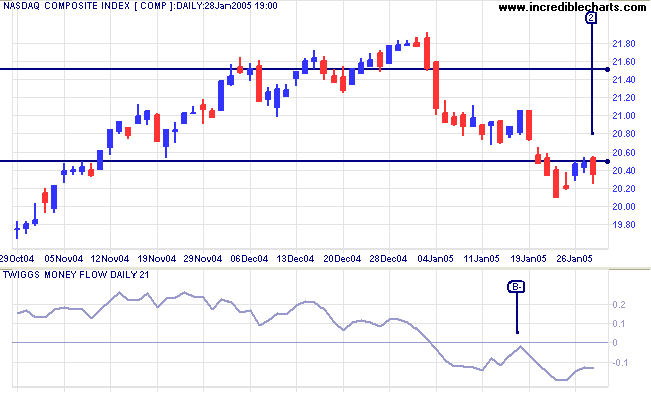
The Nasdaq Composite index appears more bearish than the
Dow, having penetrated the first line of support at 2050. This
was followed by a short pull-back to test the new resistance
level. Resistance has held but I am suspicious of the long tail
on Friday's candle [2] which, similar to the Dow, signals buying
support. A close above 2050 would be a strong bull signal.
On the other hand, a further downward move would indicate that a test of 1900 is likely.
Twiggs Money Flow (21-day) continues to signal distribution after the bearish peak below the zero line at [B-].
On the other hand, a further downward move would indicate that a test of 1900 is likely.
Twiggs Money Flow (21-day) continues to signal distribution after the bearish peak below the zero line at [B-].
The S&P 500 has so far held above support at
1160/1140. If the index respects this initial level of support
that would be a strong bull signal. However, the Nasdaq may drag
the index lower.
A fall below support at 1100 would have (long-term) bearish implications.
A fall below support at 1100 would have (long-term) bearish implications.
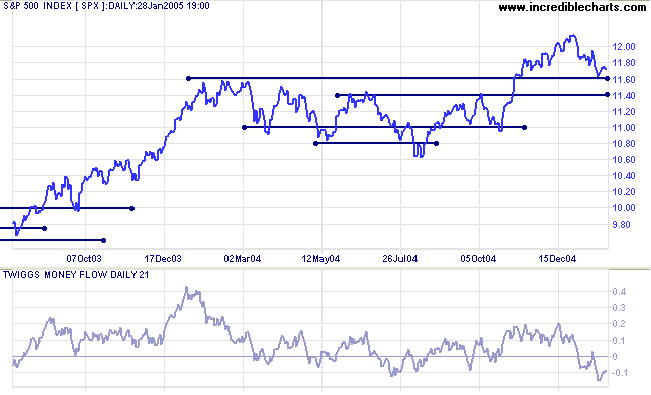
Twiggs Money Flow continues to signal distribution, remaining
below the zero line.
|
|
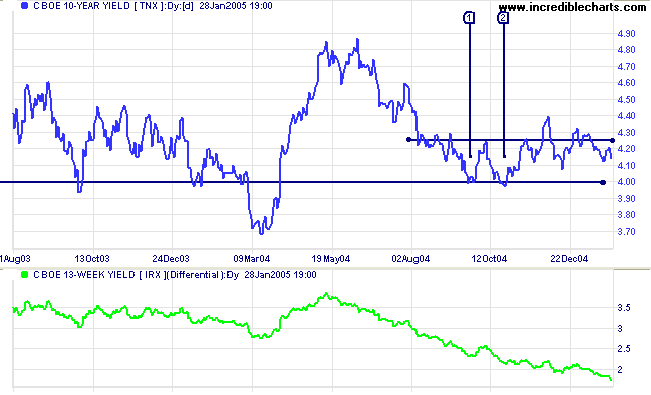
Treasury yields
The yield on 10-year treasury notes remains soft, consolidating in a narrow band above 4.00%, despite the Fed being almost certain to raise interest rates by another quarter per-cent at next week's meeting.
The yield differential (10-year T-notes minus 13-week T-bills) continues to fall, reaching 1.75% this week. Below 1.0% would be a long-term bear signal for equity markets.
Gold
New York: Spot gold has consolidated in a narrow range between $420 and $430. A close below $420 would signal continuation of the intermediate down-trend, with a likely test of support at $400 and possibly the 1-year low of $375.
Though less likely, a break above $430 would signal another test of $450 (the one-year high).
Friday's close was $425.20.
|
ASX Australia
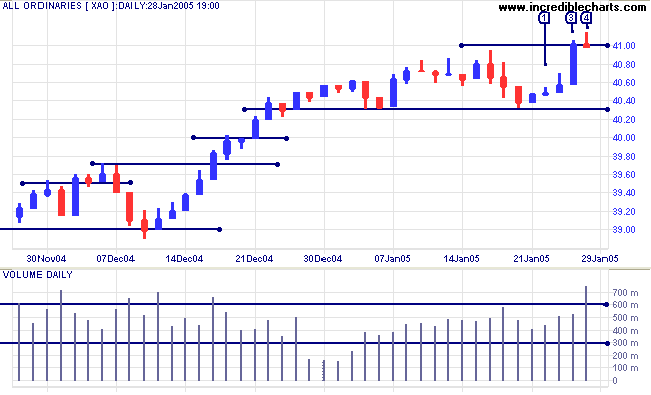
After a hesitant start, with tall shadows signaling resistance on Monday [1] and Tuesday, the All Ordinaries rallied to a new high on Thursday [3]. The index has now encountered committed selling, with a weak close and strong volume at [4]. I expect resistance at 4100 to hold and a downswing to test support at 4030.
A close above 4100 (or a rise above the high of [4]) would signal continuation of the rally.
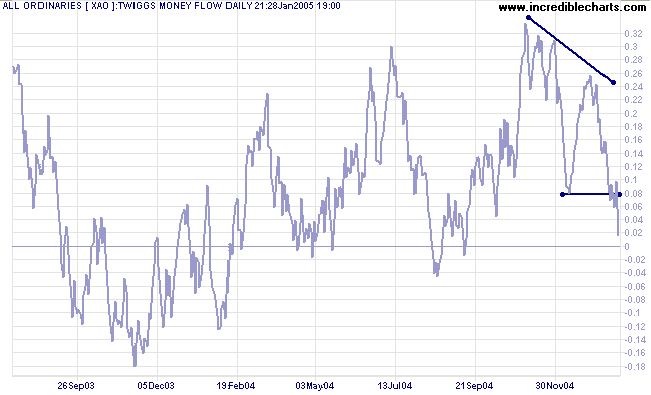
Lower highs on 21-day
Twiggs Money Flow, followed by a fall below the previous low,
signal distribution. A fall below zero would add further
confirmation.
The primary trend still appears strong but we need to bear in mind that at some point there is likely to be a correction back to 3450. This is based on observation of the All Ords over the past 25 years, where the index has regularly tested support at previous highs in an up-trend.
The primary trend still appears strong but we need to bear in mind that at some point there is likely to be a correction back to 3450. This is based on observation of the All Ords over the past 25 years, where the index has regularly tested support at previous highs in an up-trend.
For further assistance, read About
the Trading Diary.
Colin Twiggs
No act of kindness,
no matter how small,
is ever wasted.
~ Aesop
no matter how small,
is ever wasted.
~ Aesop
Back Issues
Access the Trading Diary Archives.

Author: Colin Twiggs is a former investment banker with almost 40 years of experience in financial markets. He co-founded Incredible Charts and writes the popular Trading Diary and Patient Investor newsletters.
Using a top-down approach, Colin identifies key macro trends in the global economy before evaluating selected opportunities using a combination of fundamental and technical analysis.
Focusing on interest rates and financial market liquidity as primary drivers of the economic cycle, he warned of the 2008/2009 and 2020 bear markets well ahead of actual events.
He founded PVT Capital (AFSL No. 546090) in May 2023, which offers investment strategy and advice to wholesale clients.