|
New Diary Format |
|
We are experimenting with a new format for
the Weekly Trading Diary in order to speed up delivery
times, improve the delivery of images (both charts and ads)
and reduce the number of bounced messages (from firewalls
and spam filters). The Weekly Diary will be published on the website at https://tradingdiary.incrediblecharts.com/trading_diary.php. It may be useful to save this address to your Favorites folder. You will receive a short email notifying you when the Diary has been published. Click on the link provided and the Diary will open in your default browser. Please report any difficulties to support. |
Trading Diary
July 17, 2004
These extracts from my daily trading diary
are for educational purposes
and should not be interpreted as investment
advice. Full terms and conditions can be found at Terms
of Use.
USA
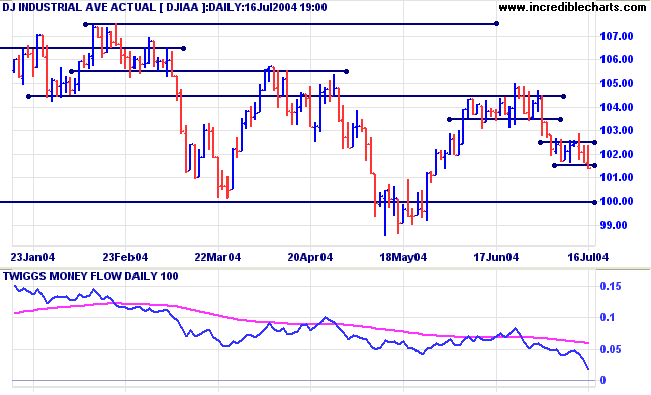
The Dow Industrial Average is headed for a test of support at 10000/9900: consolidation over the last 8 days ended with a downward break on higher volume.
The long-term pattern also reflects consolidation and can break out in either direction. An upward breakout is more likely because we are in an up-trend, but the possibility of a reversal cannot be ignored. Direction will only be clear when we have a breakout from the pattern: above 10500, or below 9900, followed by a pull-back that confirms the breakout.
Twiggs Money Flow is falling steeply, signaling distribution.
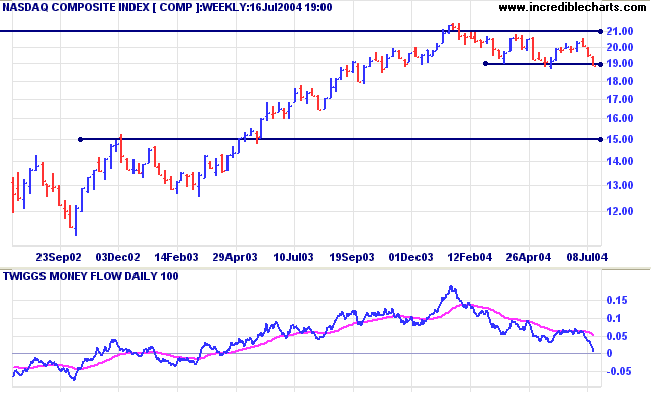
The Nasdaq Composite has penetrated
support at 1900. This may signal a reversal of the primary trend.
Further downward movement, followed by a pull-back that respects
the new 1900 resistance level, would confirm this.
Recovery back above 2100 would be a bullish sign.
Twiggs Money Flow is falling sharply, signaling distribution.
Recovery back above 2100 would be a bullish sign.
Twiggs Money Flow is falling sharply, signaling distribution.
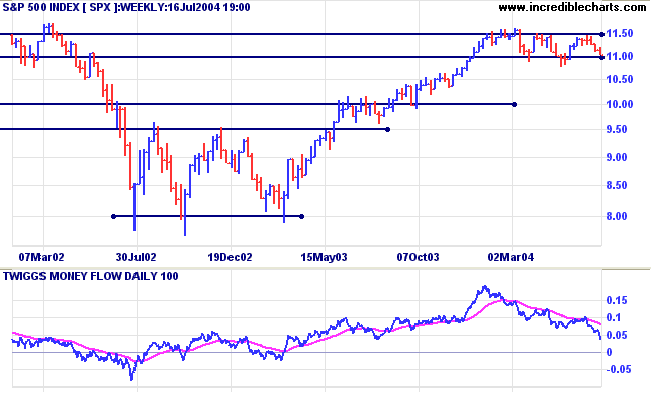
The S&P 500 also threatens to break
out below the consolidation pattern of recent months, testing
support at 1100. A downward breakout will require confirmation
from a pull-back that respects the new 1100 resistance
level.
Twiggs Money Flow signals strong distribution.
Twiggs Money Flow signals strong distribution.
NYSE Bullish Percent
The NYSE Bullish Percent Index eased to 64.22%. A fall below 60.0% would be a strong bear signal.
The NYSE Bullish Percent Index eased to 64.22%. A fall below 60.0% would be a strong bear signal.
|
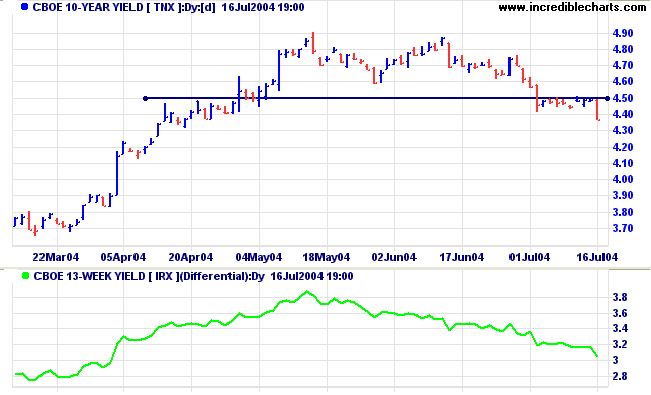
Treasury yields The yield on 10-year treasury notes reflects weaker economic data: a retreat back below support at 4.50% before consolidatiion in a narrow range. This was followed by a strong downward breakout on Friday. Expect a test of support at 3.60% (if there is no immediate reversal above 4.40% on Monday or Tuesday). A break back above 4.50% would be bullish. The yield differential (10-year T-notes minus 13-week T-bills) remains healthy at 3.0%. |
|
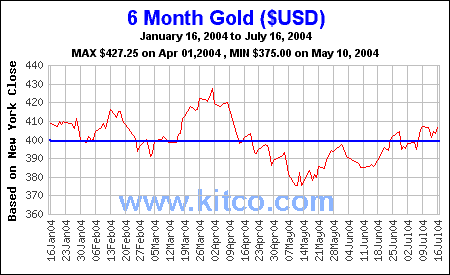
Gold
New York: Spot gold closed the week at $406.20. The intermediate up-trend is likely to test resistance at $427.25.
New York: Spot gold closed the week at $406.20. The intermediate up-trend is likely to test resistance at $427.25.
|
ASX Australia The All Ordinaries consolidated for several days (after breaking through resistance at 3550) before a sharp fall on Wednesday [w] on higher volume. A marginal new high above a previous peak is normally a bearish sign. Declining volume over the last month signals a lack of buying pressure. Expect either a consolidation over the next few weeks or a re-test of support levels at 3450 and 3350. |
FREE trial -
Click Here
|
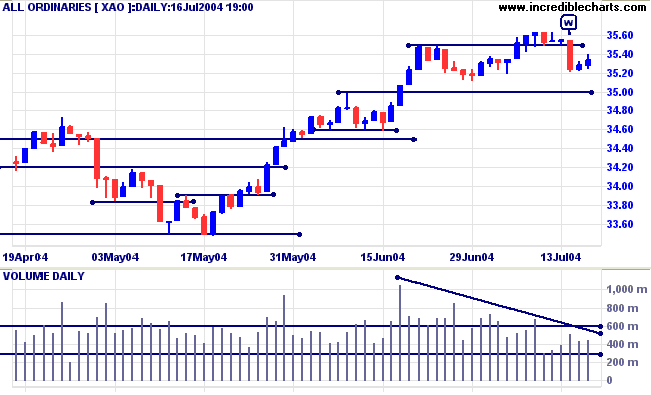
A secondary correction that respects support at
the previous high of 3450 would be a long-term bull
signal.
A fall below 3350 would signal reversal of the primary trend.
Twiggs Money Flow is rising steeply, signaling strong accumulation.
A fall below 3350 would signal reversal of the primary trend.
Twiggs Money Flow is rising steeply, signaling strong accumulation.
Point & Figure - Spikes
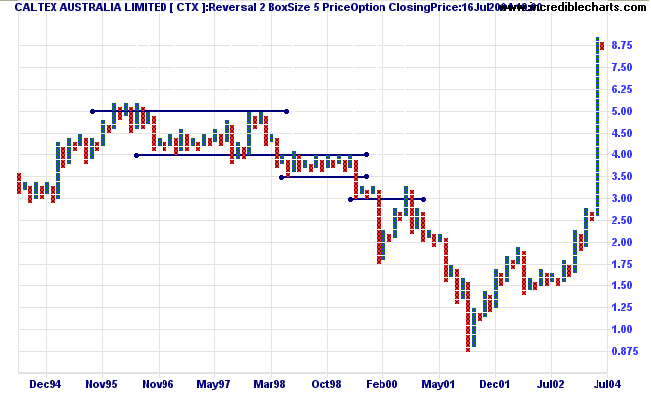
In the June 5th newsletter we discussed Spikes, where a stock rallies without any significant corrections or consolidations. These tend to become more and more unstable the higher they climb. Reactions, when they do arrive, are often highly volatile and a trader can lose much of his/her hard-won gains if not careful.
A conventional stop loss strategy, moving up stops below each successive trough, will not help in this scenario - there are no recent troughs. My strategy is to exit at the first sign of a correction: at the start a new column of Os. I do not want to be judged on the strength of a single call, but it will be interesting to see how Caltex [CTX] develops over the next few weeks.
Point & Figure - Marginal New
Highs/Lows
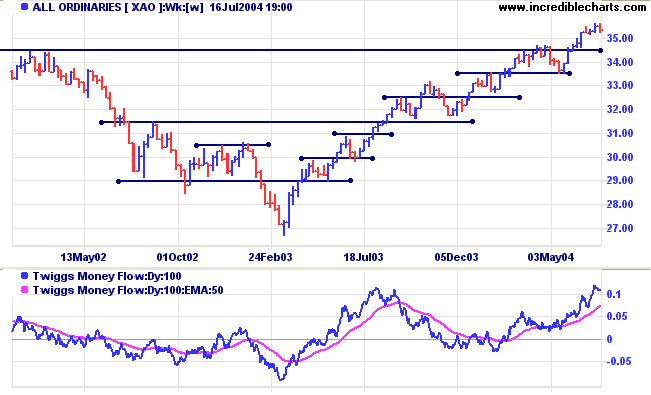
Most traders are aware that equal highs signal resistance and are often precursors to a period of consolidation and possibly even a double-top reversal. Likewise equal lows signal support and warn of a period of consolidation or a double-bottom reversal. A more elusive warning sign, often undetected on a normal bar or candlestick chart, is a marginal new high in an up-trend or marginal new low in a down-trend.
Marginal new highs are formed when price rallies above the previous high during an up-trend but fails to make significant further gains, normally only exceeding the previous column of Xs by a single box. The pattern signals a loss of momentum and often precedes a major consolidation or reversal. The All Ordinaries chart displays some excellent examples:
- Marginal new highs at [b] warn of a major top forming at the previous high, followed by a strong reversal to below 3000;
- At [d] marginal new highs signals that the attempted recovery is running out of gas; followed a sharp drop to below 2680.
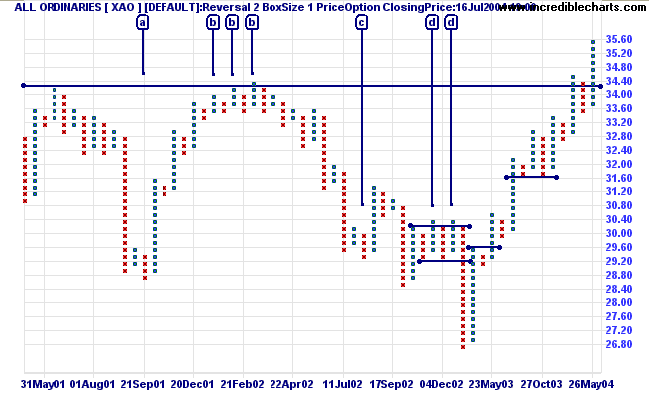
Marginal new lows are formed when price falls
below the previous low during a down-trend but then fails to make
significant further losses. The new column of Os will normally
only exceed the previous column by a single box. The marginal new
low signals a loss of downward momentum, often before a major
consolidation or reversal. On the All Ordinaries chart (above)
there are two fine examples:
- A marginal new low at [a] precedes a major recovery after the September 11 crash; and
- A marginal new low at [d] warns of a trend reversal - a bear market rally as it turns out, but a significant move nonetheless.
About
the Trading Diary has been expanded to offer further
assistance to readers, including directions on how to search the
archives.
Colin Twiggs
Do the thing you are afraid to do
and the death of fear is certain.
~ Ralph Waldo Emerson
and the death of fear is certain.
~ Ralph Waldo Emerson
Back Issues
Click here to access the Trading Diary Archives.
Click here to access the Trading Diary Archives.
Back Issues
Access the Trading Diary Archives.

Author: Colin Twiggs is a former investment banker with almost 40 years of experience in financial markets. He co-founded Incredible Charts and writes the popular Trading Diary and Patient Investor newsletters.
Using a top-down approach, Colin identifies key macro trends in the global economy before evaluating selected opportunities using a combination of fundamental and technical analysis.
Focusing on interest rates and financial market liquidity as primary drivers of the economic cycle, he warned of the 2008/2009 and 2020 bear markets well ahead of actual events.
He founded PVT Capital (AFSL No. 546090) in May 2023, which offers investment strategy and advice to wholesale clients.