|
Next Update |
|
Incredible Charts version 4.0.3.211 will be released next
week. |
Trading Diary
June 5, 2004
Twiggs Money Flow (not shown) is still bearish.
Twiggs Money Flow continues to display a strong bear signal.
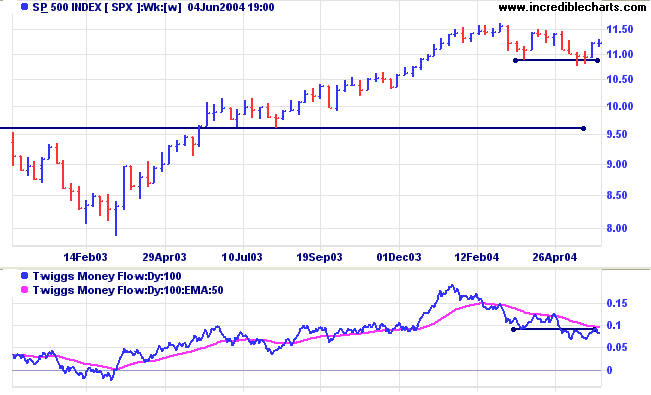
The Chartcraft Bullish Percent Index recovered to 62.07% but is still on Bear Alert status.
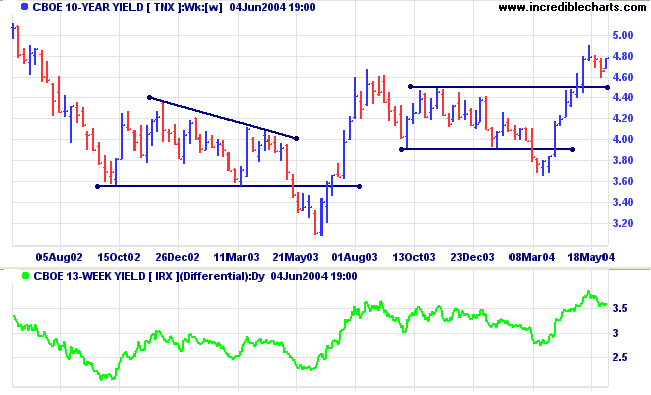
The yield on 10-year treasury notes appears to be consolidating above support at 4.50%. This would confirm the strength of the primary up-trend.
The yield differential (10-year T-notes minus 13-week T-bills) at 3.6% reflects imminent rates increases.
New York: Spot gold penetrated support at 390 before recovering to $390.60 shortly before Friday's close. A pull-back that respects support at 390 would signal a likely re-test of resistance at the previous 2004 highs. A break below support at 390 would indicate a bearish consolidation or slow down-trend.

Incredible Charts - now with US
Data
|
FREE trial - Click Here
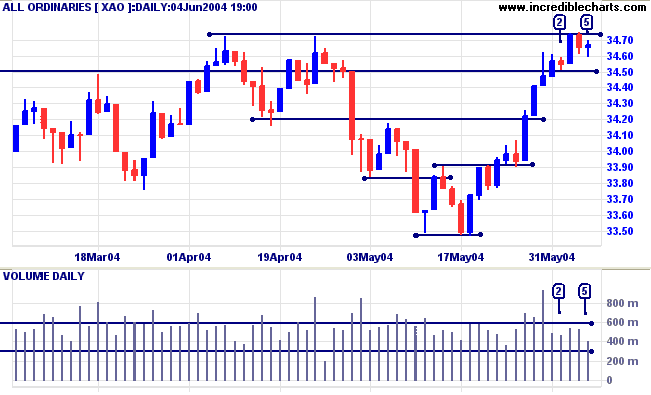
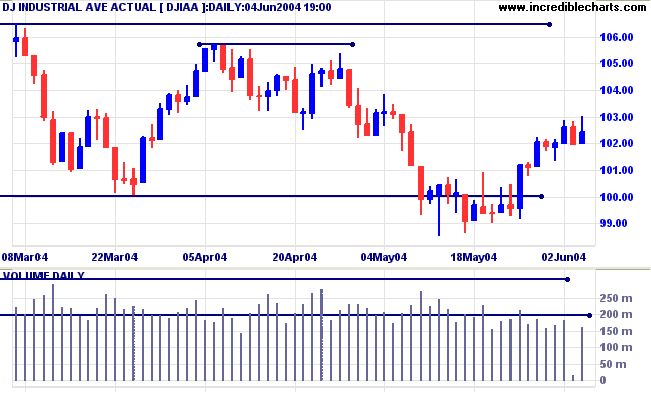
Volume over the last few days appears light; and Twiggs Money Flow (not shown) continues to display a bearish divergence.
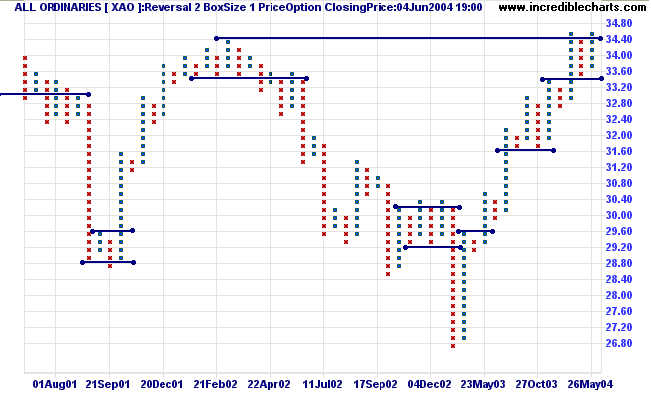
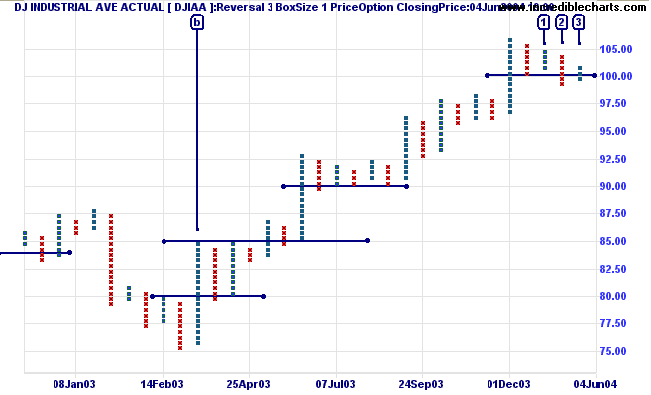
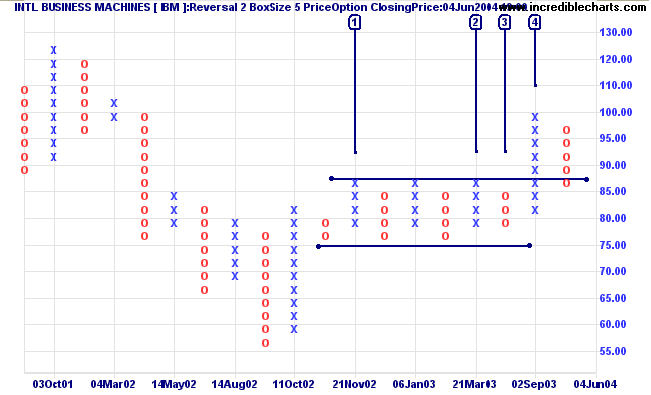
It is important to use a low reversal amount when scanning for consolidations. I find a reversal amount of 2 most useful for this purpose, being roughly equivalent to the method originally used by De Villiers & Taylor (The Point & Figure Method of Anticipating Stock Price Movements, 1933). Higher reversal amounts eliminate the narrow fluctuations found in most consolidations.
Narrow consolidations above and below support or resistance levels give important signals about buyer and seller behavior. I first discovered their importance when reading Schwager on Futures: Technical Analysis by Jack Schwager.
In an up-trend we are likely to encounter consolidation in a narrow range above or below resistance:
- Consolidation below resistance indicates that buyers do not have sufficient strength to overcome selling pressure at the resistance level. But instead of being overwhelmed, with a resultant correction, they are buying up all available stock in a narrow band below resistance. Continued accumulation is likely to result in a shortage of available stock - and a consequent rise in price.
- Consolidation above resistance, after a breakout, also signals accumulation - and a subsequent price rise.
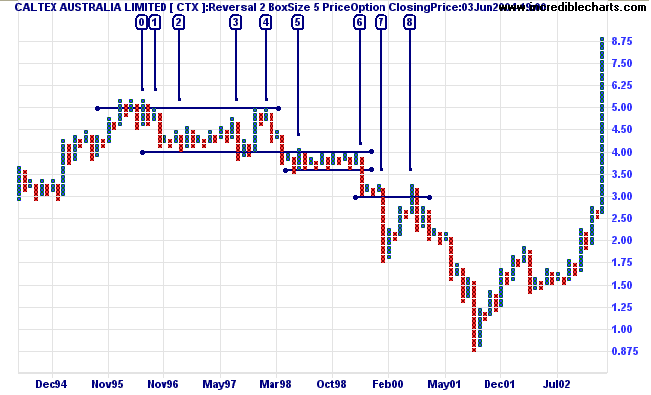
The opposite occurs in a down-trend: consolidation is likely to occur at support levels.
- Consolidation above support indicates that sellers do not have sufficient strength to overcome buying pressure but, instead of being overwhelmed, they continue to sell stock in sufficient quantity to maintain price in a narrow band above support. Continued distribution is likely to result in a shortage of ready buyers (a surplus of stock) - and a consequent price fall.
- Consolidation after a breakout below support, signals that there are insufficient buyers to rally price above the new resistance level and are likely to give way under continued selling pressure.
Basic point and figure chart patterns are explained at the Trading Guide: P&F Chart Patterns.
You can stand there with the bat on your shoulder for six months until you get a fat pitch.
~ Warren Buffett
Click here to access the Trading Diary Archives.
Back Issues

Author: Colin Twiggs is a former investment banker with almost 40 years of experience in financial markets. He co-founded Incredible Charts and writes the popular Trading Diary and Patient Investor newsletters.
Using a top-down approach, Colin identifies key macro trends in the global economy before evaluating selected opportunities using a combination of fundamental and technical analysis.
Focusing on interest rates and financial market liquidity as primary drivers of the economic cycle, he warned of the 2008/2009 and 2020 bear markets well ahead of actual events.
He founded PVT Capital (AFSL No. 546090) in May 2023, which offers investment strategy and advice to wholesale clients.