Spam Filters
If you install a spam filter on your computer, please
remember to create permission for
*incrediblecharts.com -- so that you continue to
receive the Trading Diary and Chart Forum notices. The newsletter can also be viewed at https://tradingdiary.incrediblecharts.com/trading_diary.php |
Trading Diary
February 3, 2004
These extracts from my daily trading diary are
for educational purposes and should not be interpreted as
investment advice. Full terms and conditions can be found at
Terms
of Use .
USA
The Dow Industrial Average formed an
inside day, closing at 10505 on low volume.
The intermediate trend is up. The consolidation below resistance at 10600 signals uncertainty. A fall below Thursday's low of 10417 would signal reversal to a down-trend, with a likely test of support at 10000.
The primary trend is up. A fall below support at 9600 will signal reversal.
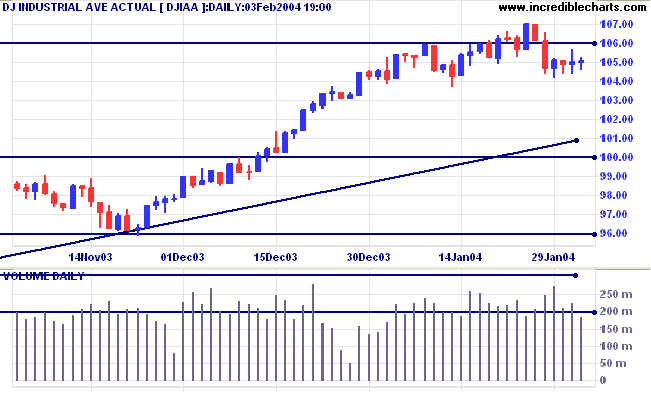
The intermediate trend is up. The consolidation below resistance at 10600 signals uncertainty. A fall below Thursday's low of 10417 would signal reversal to a down-trend, with a likely test of support at 10000.
The primary trend is up. A fall below support at 9600 will signal reversal.
The Nasdaq Composite formed an
inside day, closing at 2066 on lower volume.
The intermediate trend is uncertain.
The primary trend is up. A fall below support at 1640 will signal reversal.
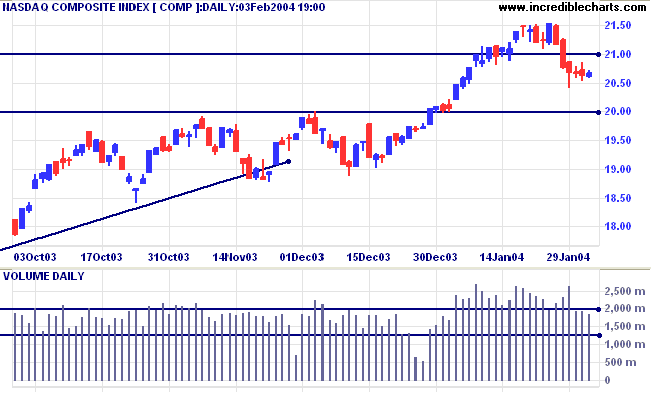
The intermediate trend is uncertain.
The primary trend is up. A fall below support at 1640 will signal reversal.
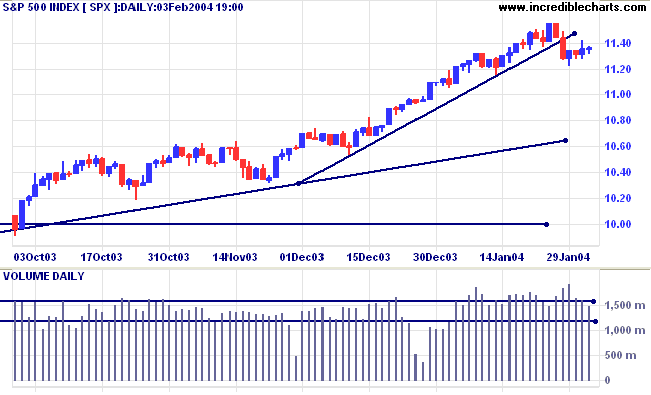
The S&P 500 also formed an inside day,
closing 1 point up at 1136 on lower volume.
The intermediate trend is up. A fall below Thursday's low of 1122 would signal reversal to a down-trend.
Short-term: Bullish if the S&P500 is above 1155. Bearish below 1122.
The intermediate trend is up. A fall below Thursday's low of 1122 would signal reversal to a down-trend.
Short-term: Bullish if the S&P500 is above 1155. Bearish below 1122.
The primary trend is up. A fall below 960 would
signal reversal.
Intermediate: Bullish above 1155.
Long-term: Bullish above 1000.
Intermediate: Bullish above 1155.
Long-term: Bullish above 1000.
The Chartcraft NYSE Bullish % Indicator is down
at 84.62%.
Cisco beats forecasts
The Network equipment manufacturer reports earnings of 18 cents a share and sales up 14.5% over the same quarter last year. (more)
Treasury yields
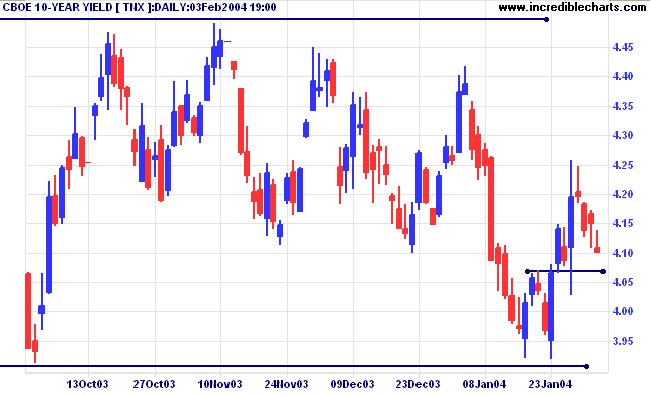
The retracement continues, with the yield on 10-year treasury notes down at 4.10%.
The intermediate trend is up.
The primary trend is up. A close below 3.93% would signal reversal.
The retracement continues, with the yield on 10-year treasury notes down at 4.10%.
The intermediate trend is up.
The primary trend is up. A close below 3.93% would signal reversal.
Gold
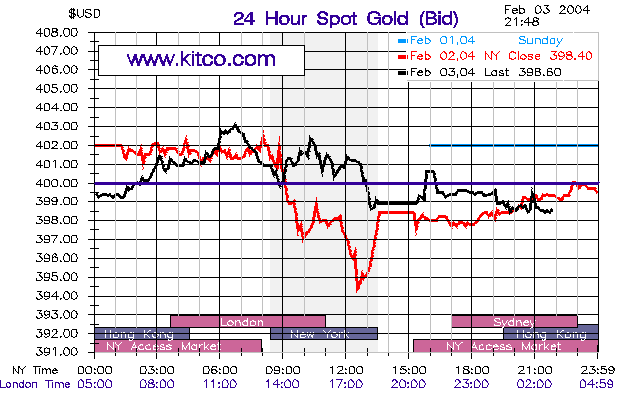
New York (21.48): Spot gold tested resistance at 400 before sliding to $398.60.
The intermediate trend is down.
The primary trend is up.
New York (21.48): Spot gold tested resistance at 400 before sliding to $398.60.
The intermediate trend is down.
The primary trend is up.
ASX Australia
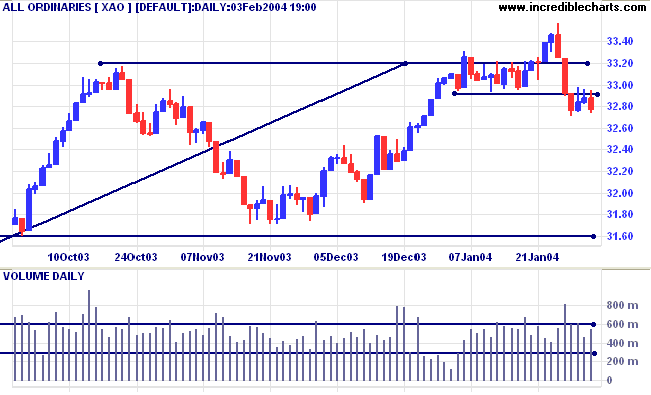
The All Ordinaries continues to consolidate below resistance,
closing 10 points lower at 3277 on higher volume; a bearish
sign.
A fall below 3271 would signal an intermediate down-trend, with a likely test of support at 3160.
Short-term: Bullish above 3350. Bearish below 3271 (Thursday's low).
A fall below 3271 would signal an intermediate down-trend, with a likely test of support at 3160.
Short-term: Bullish above 3350. Bearish below 3271 (Thursday's low).
Twiggs Money Flow (100) has penetrated its 3-month support level;
a further bearish sign.
The primary trend is up. A fall below 3160 (the October 1 low) would signal reversal.
Intermediate term: Bullish above 3350. Bearish below 3160.
Long-term: Bearish below 3160.
The primary trend is up. A fall below 3160 (the October 1 low) would signal reversal.
Intermediate term: Bullish above 3350. Bearish below 3160.
Long-term: Bearish below 3160.
Energy Developments [ENE]
Last covered on September 4, 2003.
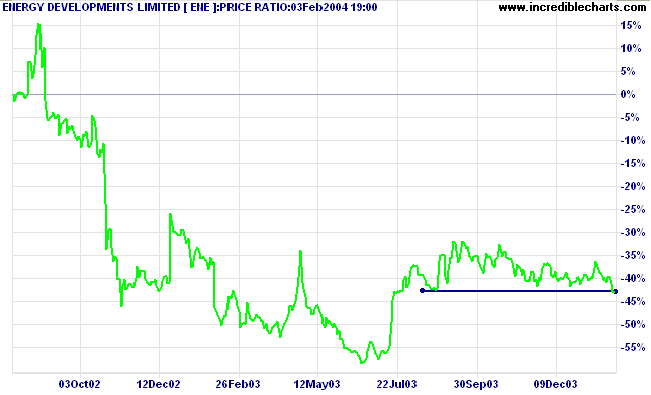
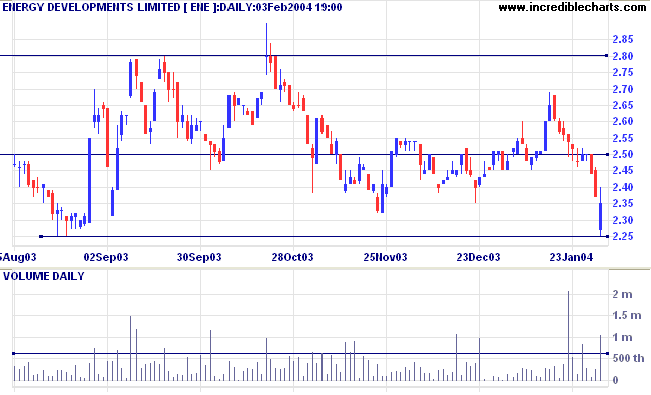
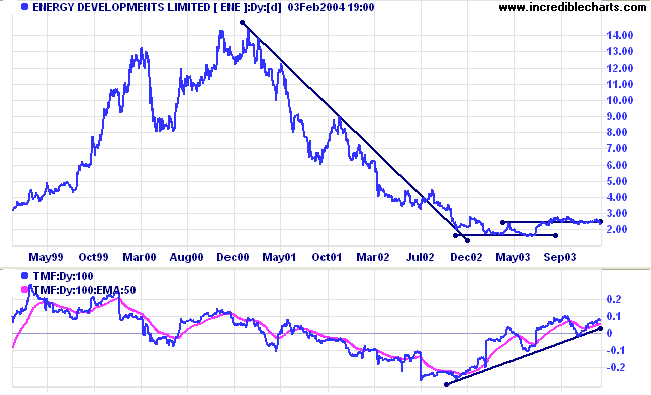
ENE has formed a broad Stage 1 base over the past year. It broke above resistance at 2.50 but has then consolidated in a narrow range between 2.80 and 2.25 for the last 6 months. What is intriguing is the continued rise of Twiggs Money Flow, signaling accumulation.
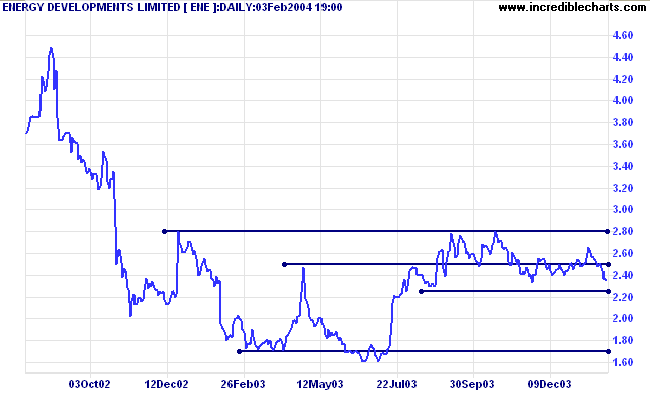
In a shorter time frame, the false break (June 2003) below the
previous low signaled the start of a fast rally. Price later
completed a double bottom pattern, with a break above 2.50, but
failed to break through resistance at 2.80.
Price fell back to test support at 2.25. Relative Strength (price
ratio: xao) shows weakness, with declining peaks. The break below
support should put us on the alert for further bear signals. A
pull-back that respects the new resistance level would be a
strong bear signal.
Apologies for the eye-strain, I had to reduce the indicator width
to fit the 6-month price chart into the image. Price gapped down
at today's open to test support at 2.25, but then rallied
strongly to form an
open-close reversal (a bullish sign) on strong volume. We may
see a rally testing resistance at 2.80, but the overall market is
bearish at present. A close below 2.25 would be a bear signal; a
close above 2.80 would be a bull signal. It would be prudent to
wait for a pull-back to confirm the breakout: by respecting the
new resistance/support level.
About
the Trading Diary has been expanded to offer further
assistance to readers, including directions on how to search the
archives.
Colin Twiggs
Technical skill is mastery of complexity.
Creativity is mastery of simplicity.
~ Christopher Zeeman.
Creativity is mastery of simplicity.
~ Christopher Zeeman.
Stock Screens: Indexes
Dow Jones Industrial Average and S&P
500 have been added to the list of Indexes.
If you screen US stocks you can now restrict your search to
components of either of these indexes.
Back Issues
You can now view back issues at the Daily Trading Diary Archives.
Back Issues
Access the Trading Diary Archives.