The problem with stock screening watchlists has been fixed.
It is advisable to keep the following stocks in separate watchlists:
|
Trading Diary
January 12, 2004
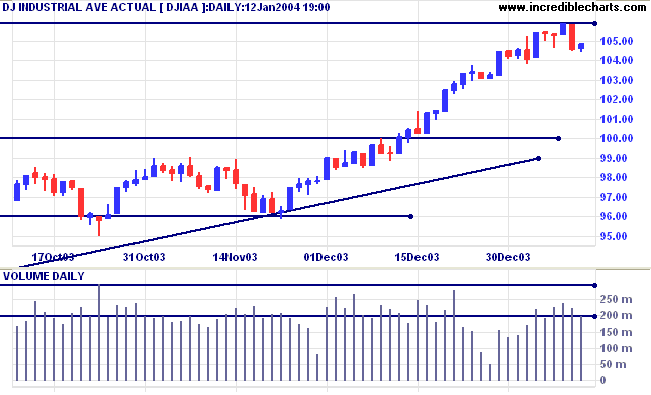
The intermediate trend is up. Consolidation in a narrow range below 10600 will be a bullish sign. A subsequent breakout above resistance would signal a likely test of 11300.
The primary trend is up. A fall below support at 9600 will signal reversal.
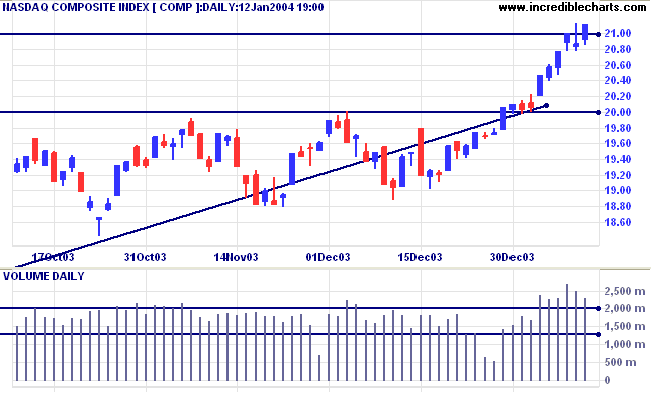
The intermediate trend is up.
The primary trend is up. A fall below support at 1640 will signal reversal.
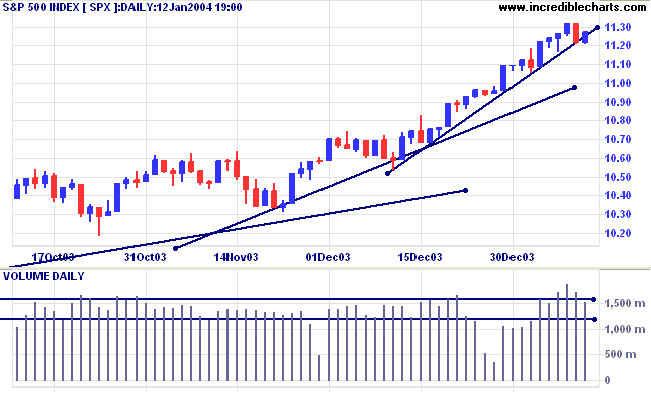
The intermediate trend is up. The next resistance level is at 1175.
Short-term: Bullish if the S&P500 is above the high of 1132 (Thursday's high). Bearish below 1120 (Friday's low).
Intermediate: Bullish above 1120.
Long-term: Bullish above 960.
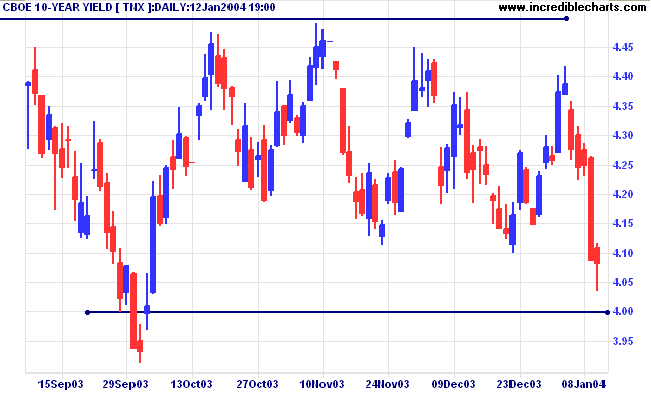
The yield on 10-year treasury notes appears headed for a re-test of support at 4.00%, closing slightly lower at 4.08%.
The intermediate trend is down.
The primary trend is up.
New York (23.28): Spot gold eased to $425.30.
The intermediate trend is up.
The primary trend is up. Expect support at 415.
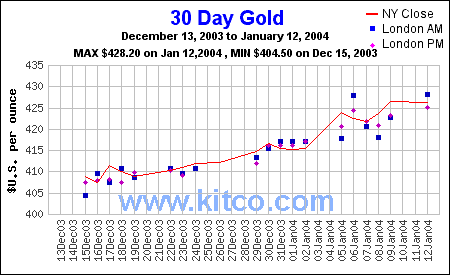
MACD (26,12,9) is above its signal line; Slow Stochastic (20,3,3) is below.
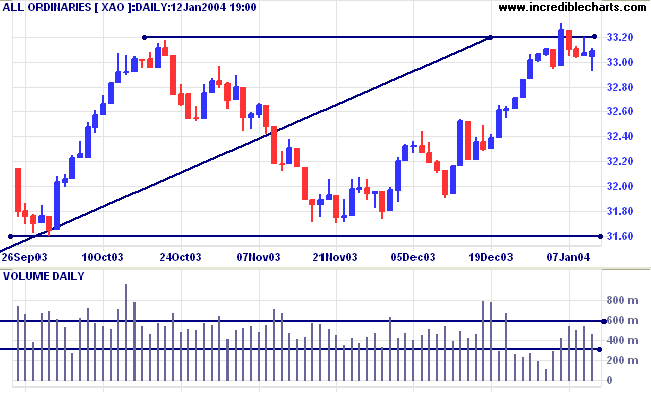
Short-term: Bullish above 3320. Bearish below 3293.
Intermediate term: Bullish above 3320. Bearish below 3160.
Long-term: Bearish below 3160.
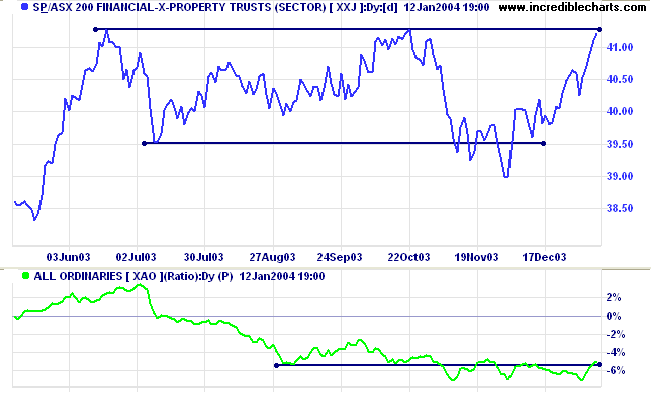
The Financial-x-Property index [XXJ] is headed for a re-test of resistance at 4127 to 4136. A close above 4127 will signal that the primary trend has turned upwards.
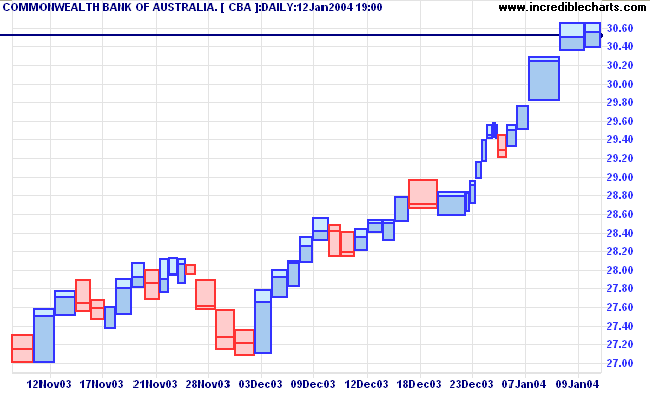
Last covered on December 1, 2003. CBA is testing resistance at the previous high of 30.52. Relative Strength (price ratio: xao) is rising strongly.
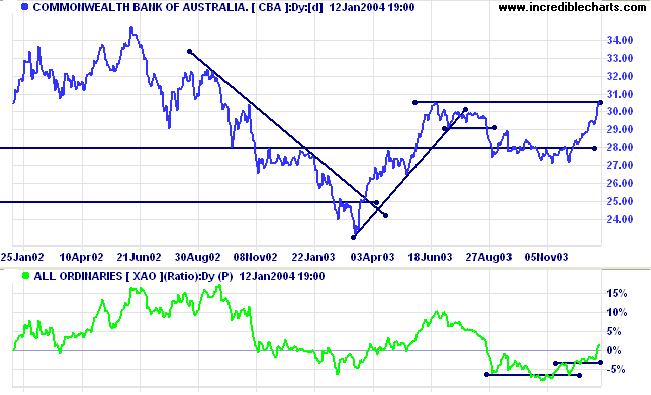
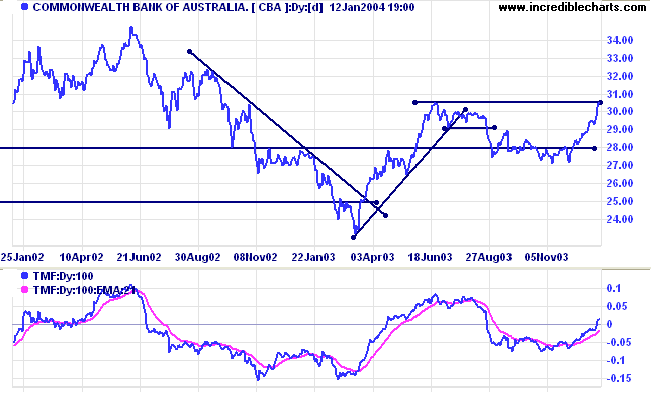
It would be premature to enter while price is testing resistance. Normal entry points are:
- while price consolidates in a narrow range below resistance (a bullish sign);
- on the breakout above resistance; and
- on a short pull-back to test the new resistance level.
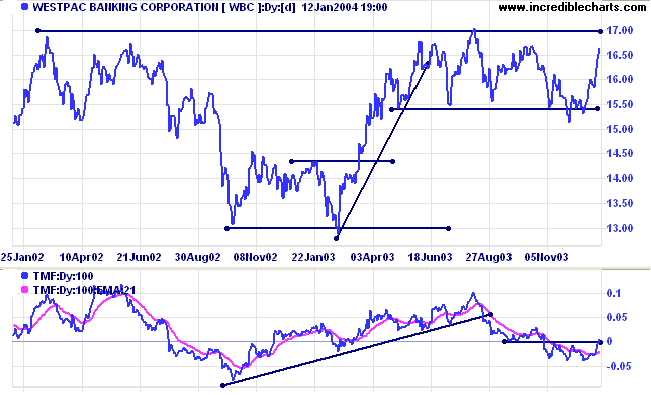
Last covered on December 1, 2003. Westpac appears headed for a test of resistance at 17.00. Twiggs Money Flow has just started to rise; Relative Strength (price ratio: xao) is level.
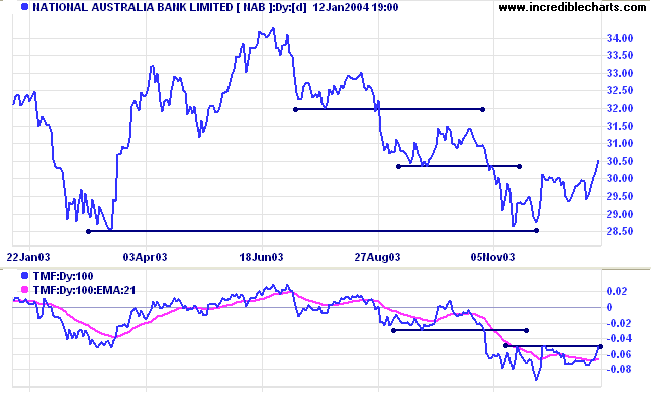
Last covered on December 1, 2003. NAB is rising off an equal low (double bottom) at 28.50. The two higher lows at 29.50 are a bullish sign. Relative Strength (price ratio: xao) is level. Twiggs Money Flow (100) has started to rise and the stock should be monitored closely.
It is the only coin you have,
and only you can determine how it will be spent.
Be careful lest you let other people spend it for you.
~ Carl Sandburg.
| In response to a number of requests, subscriptions for the Daily Trading Diary and Incredible Charts Premium Data will be offered separately, at $180 (AUD) each. The combined subscription remains at $270 (AUD). Some development work is required before the new subscription page will be ready, so this will not happen immediately. |
You can now view back issues at the Daily Trading Diary Archives.
Back Issues

Author: Colin Twiggs is a former investment banker with almost 40 years of experience in financial markets. He co-founded Incredible Charts and writes the popular Trading Diary and Patient Investor newsletters.
Using a top-down approach, Colin identifies key macro trends in the global economy before evaluating selected opportunities using a combination of fundamental and technical analysis.
Focusing on interest rates and financial market liquidity as primary drivers of the economic cycle, he warned of the 2008/2009 and 2020 bear markets well ahead of actual events.
He founded PVT Capital (AFSL No. 546090) in May 2023, which offers investment strategy and advice to wholesale clients.