Incredible Charts Version 4.0.2.700
The new version with NYSE, Nasdaq and Amex charts is now available.
Please check Help >> About to confirm that your version has automatically updated.
If there are any problems with the updater,
you can download and install the latest version over your existing version.
The new version with NYSE, Nasdaq and Amex charts is now available.
Please check Help >> About to confirm that your version has automatically updated.
If there are any problems with the updater,
you can download and install the latest version over your existing version.
Trading Diary
December 9, 2003
These extracts from my daily trading diary are
for educational purposes and should not be interpreted as
investment advice. Full terms and conditions can be found at
Terms
of Use .
USA
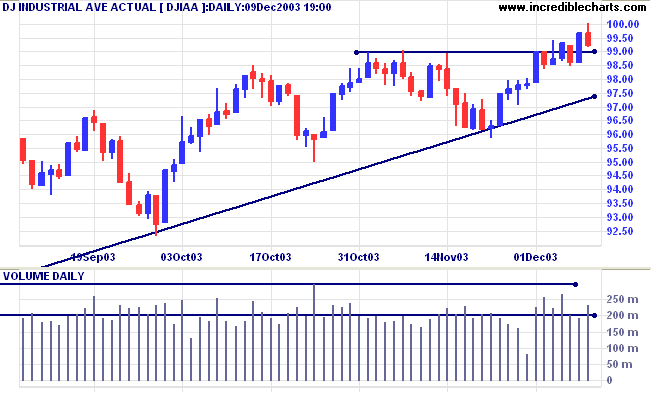
The Dow Industrial Average retreated to 9923, on
higher volume, and is likely to re-test the new 9900/9850 support
band.
The intermediate trend is uncertain. Expect support at 9600 and 9500, resistance at 10000.
The primary trend is up. A fall below support at 9000 will signal reversal.
The intermediate trend is uncertain. Expect support at 9600 and 9500, resistance at 10000.
The primary trend is up. A fall below support at 9000 will signal reversal.
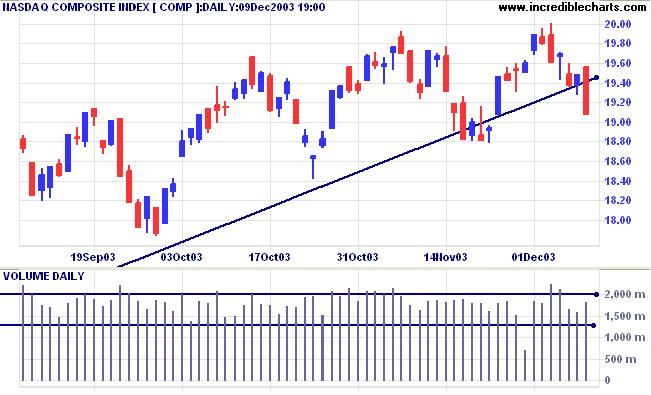
After gapping up at the open the Nasdaq
Composite fell sharply, closing 40 points lower at 1908 on higher
volume.
The intermediate trend is uncertain. Expect support at 1880 and 1840, resistance at 2000 to 2080.
The primary trend is up. The supporting trendline has been broken, after a false break (above the previous high) on December 3, both bearish signs. A fall below support at 1880 will be a strong bear signal, while a fall below 1640 will signal reversal.
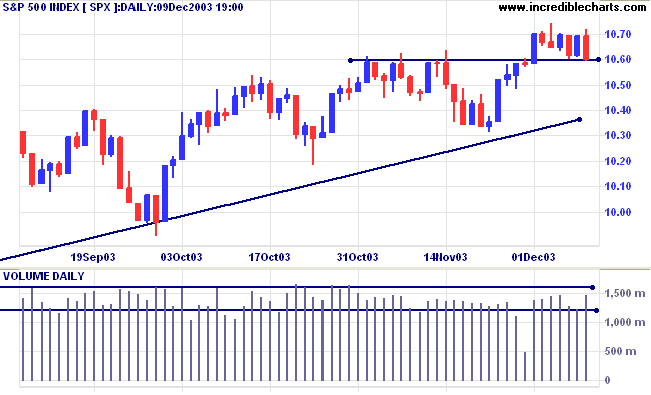
The S&P 500 lost 9 points to close at 1060
on higher volume, testing support at this level.
The intermediate trend is uncertain. A fall below 1060 would be bearish.
Short-term: Bullish if the S&P500 is above 1070. Bearish below 1060.
The intermediate trend is uncertain. A fall below 1060 would be bearish.
Short-term: Bullish if the S&P500 is above 1070. Bearish below 1060.
The primary trend is up. A fall below 960 will
signal reversal.
Intermediate: Bullish above 1070.
Long-term: Bullish above 960.
Intermediate: Bullish above 1070.
Long-term: Bullish above 960.
The Chartcraft NYSE Bullish % Indicator increased
to 82.10% (December 9).
Fed holds rates steady
The Fed discounts deflation and recognizes economic improvement but will keep rates low for the foreseeable future. (more)
The Fed discounts deflation and recognizes economic improvement but will keep rates low for the foreseeable future. (more)
Treasury yields
The yield on 10-year treasury notes rallied to 4.35%.
The intermediate trend is down.
The primary trend is up.
The yield on 10-year treasury notes rallied to 4.35%.
The intermediate trend is down.
The primary trend is up.
Gold
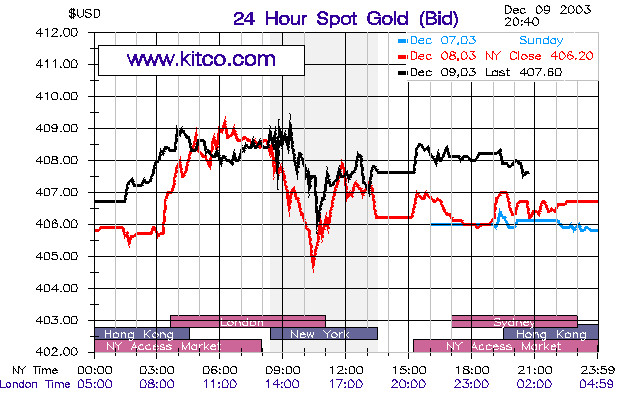
New York (20.40): Spot gold is up at $407.60.
The intermediate trend is up.
The primary trend is up. Expect support at 400, resistance at 415.
New York (20.40): Spot gold is up at $407.60.
The intermediate trend is up.
The primary trend is up. Expect support at 400, resistance at 415.
ASX Australia
The All Ordinaries closed 7 points lower at 3219
on higher volume.
The intermediate up-trend continues.
The intermediate up-trend continues.
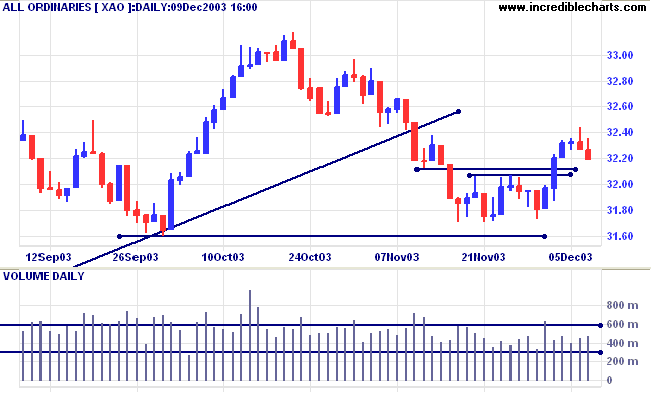
MACD (26,12,9) and Slow Stochastic (20,3,3) are
above their signal lines.
Short-term: Bullish above 3236, Friday's high. Bearish below 3173 (Monday's low).
Short-term: Bullish above 3236, Friday's high. Bearish below 3173 (Monday's low).
XAO is below the long-term trendline, signaling
weakness. The primary trend is up but will reverse if there is a
fall below 3160 (the October 1 low). Twiggs Money Flow (100)
signals accumulation, but following a large bearish triple
divergence.
Intermediate term: Bullish above 3207, the high of the last peak. Bearish below 3160.
Long-term: Bearish below 3160.
Intermediate term: Bullish above 3207, the high of the last peak. Bearish below 3160.
Long-term: Bearish below 3160.
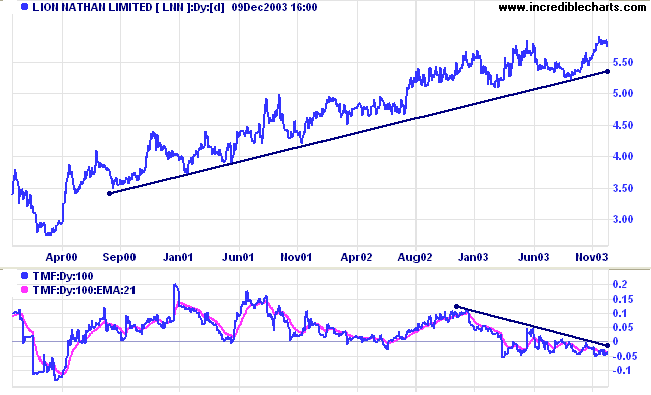
Lion Nathan [LNN]
Last covered on November 4, 2002.
LNN has been in a stage 2 up-trend for more than 3 years, but in 2003 Twiggs Money Flow (100) started to decline showing a strong bearish divergence.
Last covered on November 4, 2002.
LNN has been in a stage 2 up-trend for more than 3 years, but in 2003 Twiggs Money Flow (100) started to decline showing a strong bearish divergence.
Relative Strength (xao) is declining, with a
peak at [c] below the previous support level. This is a shorter
time-frame than the Twiggs Money Flow signal. The intermediate
trend has turned down, with price at [d] gapping below the
previous low.
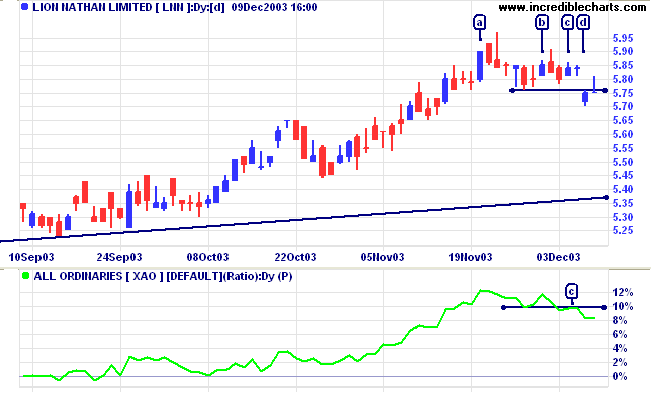
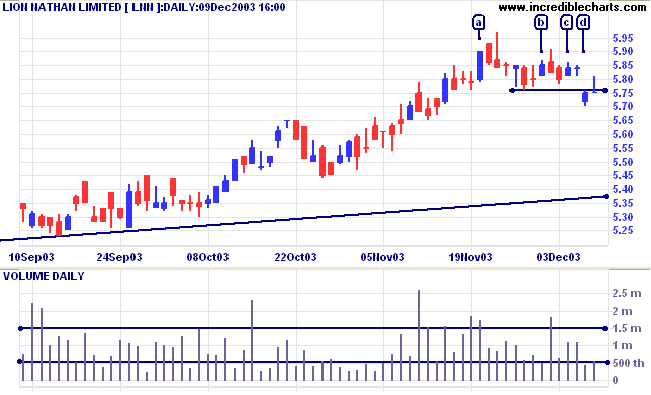
Volume is low at [d] but price was unable to
hold onto gains made the next day. LNN is likely to re-test the
primary supporting trendline.
We should not forget the signal from Twiggs
Money Flow (100) and be prepared for a trend reversal if price
breaks the trendline. If price rallies off the trendline, there
may still be opportunities for short/intermediate traders but it
would be too late for long-term traders to make fresh
entries.
Understanding
the Trading Diary has been expanded to offer further
assistance to readers, including directions on how to search the
archives.
Colin Twiggs
Enjoy your achievements as well as your
plans.
~ Max Ehrmann: Desiderata (1927)
~ Max Ehrmann: Desiderata (1927)
Stock
Screens: USA
US stocks and US indexes are still being added to the stock screen module
and should be available by next week.
US stocks and US indexes are still being added to the stock screen module
and should be available by next week.
Back Issues
You can now view back issues at the Daily Trading Diary Archives.
You can now view back issues at the Daily Trading Diary Archives.
Back Issues
Access the Trading Diary Archives.

Author: Colin Twiggs is a former investment banker with almost 40 years of experience in financial markets. He co-founded Incredible Charts and writes the popular Trading Diary and Patient Investor newsletters.
Using a top-down approach, Colin identifies key macro trends in the global economy before evaluating selected opportunities using a combination of fundamental and technical analysis.
Focusing on interest rates and financial market liquidity as primary drivers of the economic cycle, he warned of the 2008/2009 and 2020 bear markets well ahead of actual events.
He founded PVT Capital (AFSL No. 546090) in May 2023, which offers investment strategy and advice to wholesale clients.