In response to email questions from readers:
The targeted move is the projected price move for a particular chart pattern.
I do not make predictions: the market can go up or down at any time; it is only the probability (of each move) that varies. If a pattern is described as bullish, it means that the market has a higher probability of rising than of falling, and the opposite if a pattern is bearish.
Trading Diary
November 04, 2002
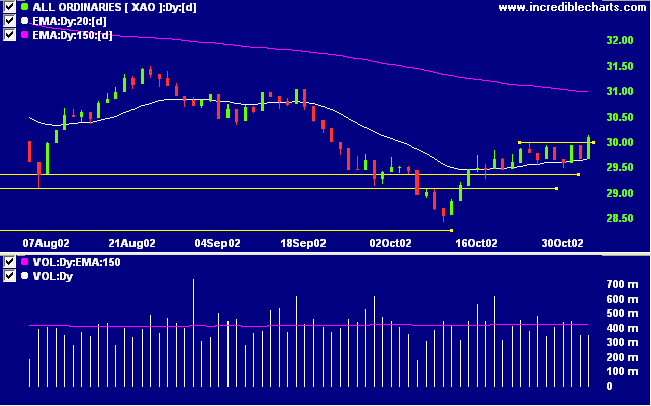
The Nasdaq Composite Index gapped up but encountered resistance above 1400, closing at 1396, up 2.6%. The primary trend will reverse if the index breaks above 1426.
The S&P 500 opened strongly but encountered resistance, closing up 8 points at 908 . The primary trend is down. The index will complete a double bottom reversal if it rises above 965.
U.S. District Judge Colleen Kollar-Kotelly approves the anti-trust settlement between Microsoft and the government and nine states. (more)
Gold
New York: Spot gold is almost unchanged at $US 318.40.
The Slow Stochastic (20,3,3) and MACD (26,12,9) are above their signal lines, while Twiggs money flow signals accumulation.

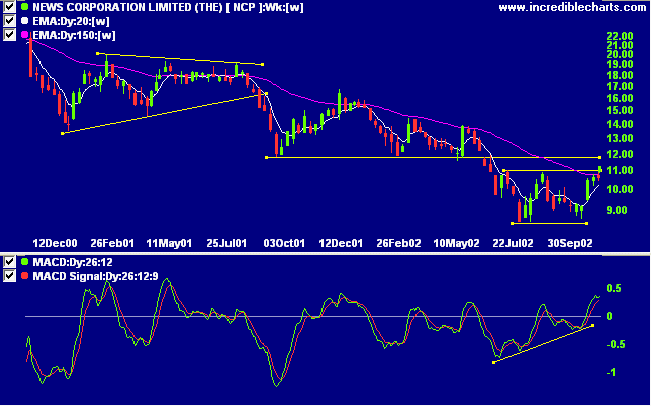
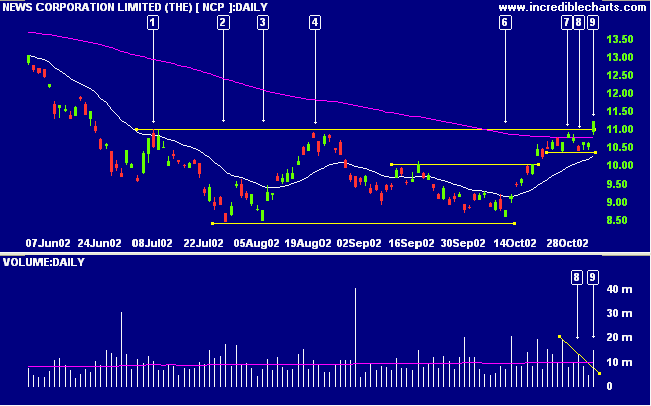
NCP has completed a double bottom reversal after a long stage 4 down-trend. Relative strength (price ratio: xao) confirms the reversal; Twiggs money flow signals accumulation and the MACD shows a bullish divergence.

This was followed by a rally back to resistance at [7]. The brief pull-back at [8] presented an opportunity to accumulate NCP at 10.60 to 10.65: when it rallied above the high on day [8]. The rally at [9] gapped up and broke the resistance level in the same day; another opportunity to accumulate the stock when it broke through 11.00. Tight stops can be placed below the low on day [8]: at 10.30 to 10.35. Buyers above 11.24 are taking on greater risk as the stop loss is more than 8% away. The prudent approach would be to wait and see if there is a pull-back to the 11.00 support level.

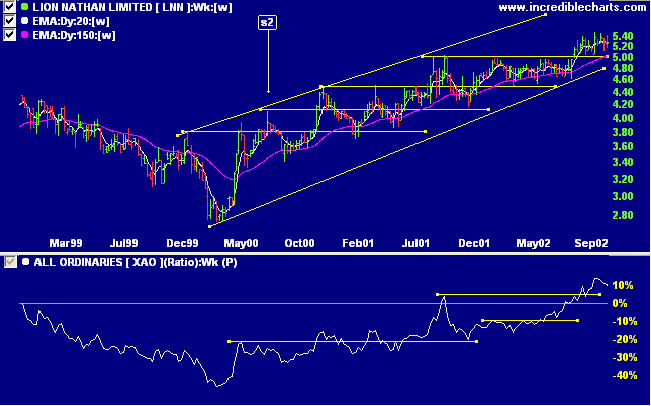
Lion Nathan is in a slow upward trend - what Rocky/Bill McLaren would call a creeping trend. Observe that each new high offers little support to the ensuing trend and is frequently penetrated; the highs act more as resistance with up to 5 equal tops forming before a breakout.

The master said: To learn something and then to put it into practice at the right time: is this not a joy?
The Analects of Confucius, 1.1.
Back Issues

Author: Colin Twiggs is a former investment banker with almost 40 years of experience in financial markets. He co-founded Incredible Charts and writes the popular Trading Diary and Patient Investor newsletters.
Using a top-down approach, Colin identifies key macro trends in the global economy before evaluating selected opportunities using a combination of fundamental and technical analysis.
Focusing on interest rates and financial market liquidity as primary drivers of the economic cycle, he warned of the 2008/2009 and 2020 bear markets well ahead of actual events.
He founded PVT Capital (AFSL No. 546090) in May 2023, which offers investment strategy and advice to wholesale clients.
