Earlier updates
In future an early edition of the Trading Diary (sans US charts)
will be available on the website and emailed before 7:00 a.m. (Sydney time).
A later US market update will be emailed around midday.
In future an early edition of the Trading Diary (sans US charts)
will be available on the website and emailed before 7:00 a.m. (Sydney time).
A later US market update will be emailed around midday.
Trading Diary
November 26, 2003
These extracts from my daily trading diary are
for educational purposes and should not be interpreted as
investment advice. Full terms and conditions can be found at
Terms
of Use .
USA
Exchanges will be closed Thursday for Thanksgiving and will trade
shortened hours on Friday.
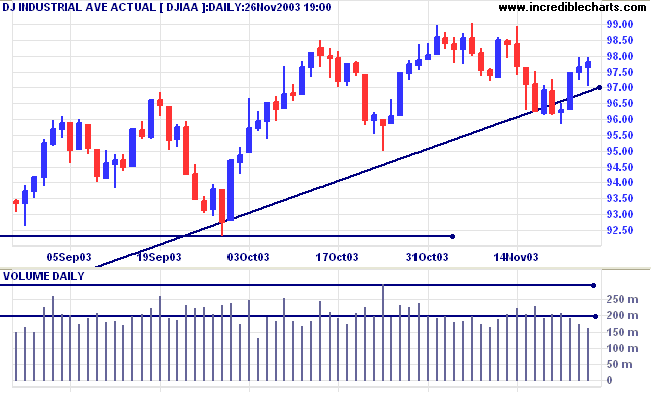
The Dow Industrial Average closed slightly up at 9780. Low volume may be due to tomorrow's holiday.
The intermediate trend is down. Expect support at 9500 and 9230.
The primary trend is up. A fall below support at 9000 will signal reversal.
The Dow Industrial Average closed slightly up at 9780. Low volume may be due to tomorrow's holiday.
The intermediate trend is down. Expect support at 9500 and 9230.
The primary trend is up. A fall below support at 9000 will signal reversal.
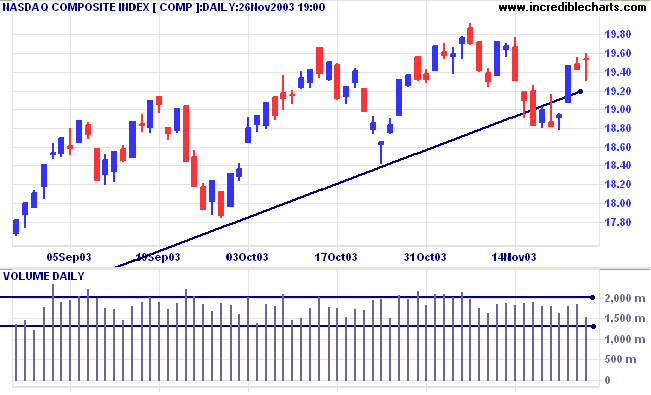
The Nasdaq Composite index closed 10 points up at 1953. Lower
volume may be due to Thanksgiving tomorrow.
The intermediate trend is down. Expect support at 1840 and 1780.
The primary trend is up. A fall below support at 1640 will signal reversal.
The intermediate trend is down. Expect support at 1840 and 1780.
The primary trend is up. A fall below support at 1640 will signal reversal.
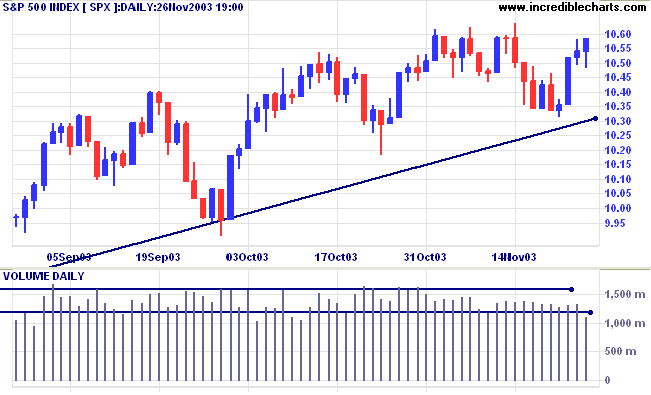
The S&P 500 gained 4 points to close at 1058.
The intermediate trend is down.
Short-term: Bullish if the S&P500 is above the high of 1064. Bearish below 1048 (Today's low).
The intermediate trend is down.
Short-term: Bullish if the S&P500 is above the high of 1064. Bearish below 1048 (Today's low).
The primary trend is up. A fall below 960 will signal
reversal.
Intermediate: Bullish above 1064.
Long-term: Bullish above 960.
Intermediate: Bullish above 1064.
Long-term: Bullish above 960.
The Chartcraft NYSE Bullish % Indicator rallied
to 80.60% (November 26).
Consumer sentiment up
The University of Michigan index of consumer confidence strengthened to 93.7 from 89.6 in October. (more)
Jobless claims fall
New unemployment claims fell to a 33-month low of 351,000 last week. (more)
Treasury yields
The yield on 10-year treasury notes closed up slightly at 4.24%.
The intermediate trend is down after bearish equal highs below a higher peak.
The primary trend is up.
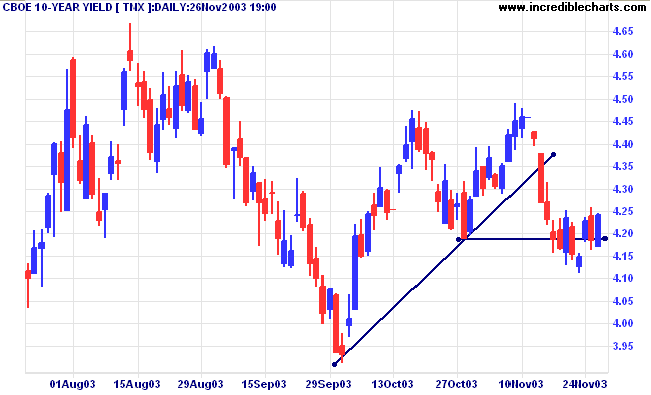
The yield on 10-year treasury notes closed up slightly at 4.24%.
The intermediate trend is down after bearish equal highs below a higher peak.
The primary trend is up.
Gold
New York (13.30): Spot gold rallied to $396.50.
The intermediate trend is up.
The primary trend is up. Expect resistance at 400 to 415.
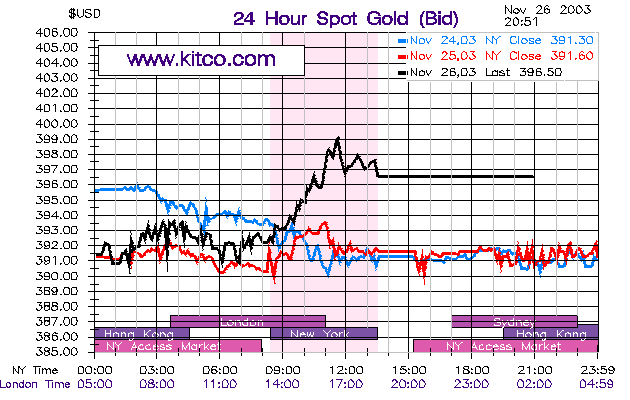
New York (13.30): Spot gold rallied to $396.50.
The intermediate trend is up.
The primary trend is up. Expect resistance at 400 to 415.
ASX Australia
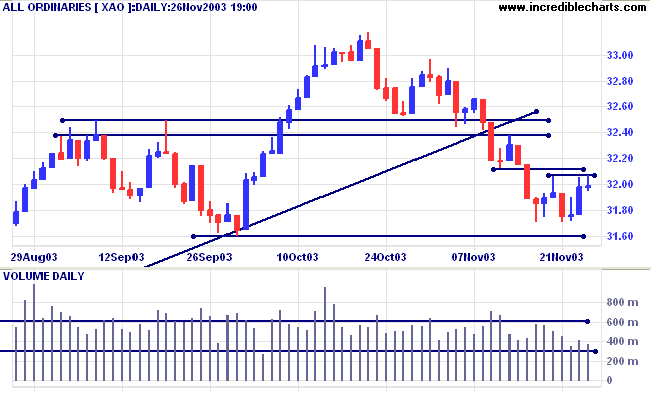
The All Ordinaries failed to break through initial resistance,
closing at 3199. Lower volume signals a lack of commitment from
buyers.
The intermediate trend is down.
MACD (26,12,9) is below its signal line; Slow Stochastic (20,3,3) has whipsawed above its signal line.
Short-term: Bullish if the All Ords rises above 3212 (the November 12 low). Bearish below today's low of 3194.
MACD (26,12,9) is below its signal line; Slow Stochastic (20,3,3) has whipsawed above its signal line.
Short-term: Bullish if the All Ords rises above 3212 (the November 12 low). Bearish below today's low of 3194.
XAO is below the long-term trendline, signaling
weakness.
The primary trend is up but will reverse if there is a fall below 3160 (the October 1 low).
Twiggs Money Flow (100) signals distribution after a bearish triple divergence.
Intermediate term: Bullish above 3250. Bearish below 3160.
Long-term: Neutral. Bearish below 3160.
The primary trend is up but will reverse if there is a fall below 3160 (the October 1 low).
Twiggs Money Flow (100) signals distribution after a bearish triple divergence.
Intermediate term: Bullish above 3250. Bearish below 3160.
Long-term: Neutral. Bearish below 3160.
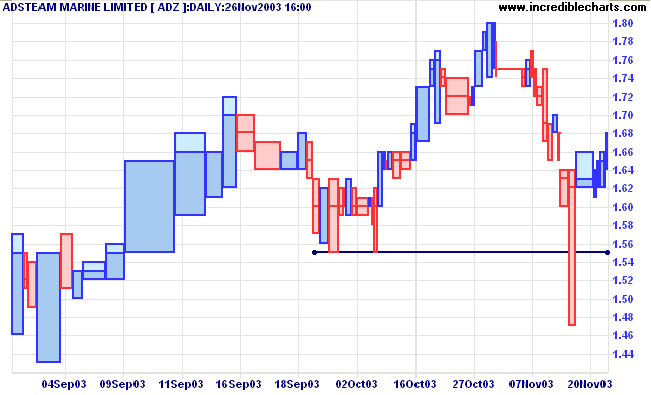
Adsteam [ADZ]
Twiggs Money Flow (100) has climbed strongly over the last 6 months, signaling accumulation, after a cathartic sell-off in February.
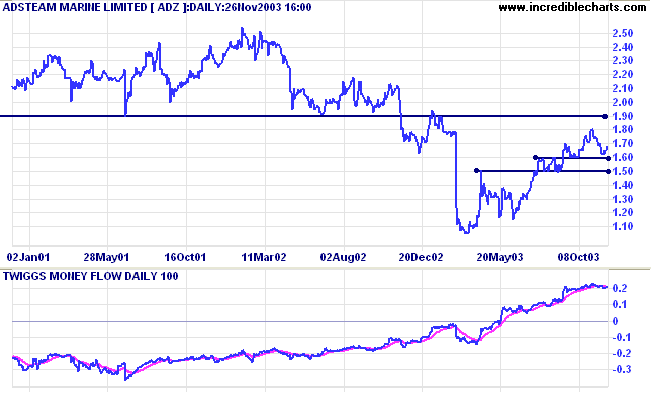
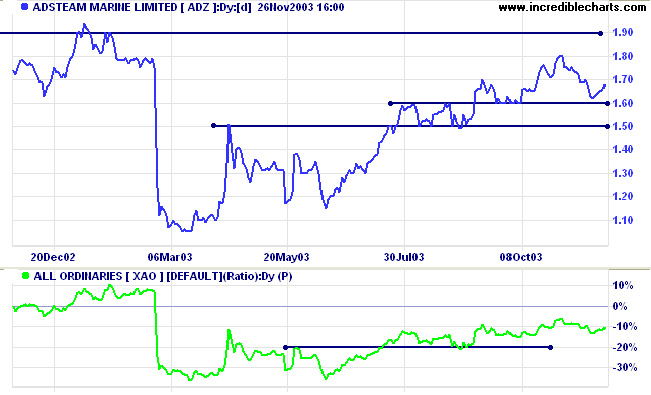
Relative Strength (xao) is rising, although the pace seems to
have slowed.
Equivolume highlights a false break on November 19th, accompanied
by low volume. Volume is thin on the latest rally, compared to
the strong accumulation in September, and we may see a re-test of
the 1.50 to 1.55 support band.
Stocks should not be bought on Relative Strength alone - the
condition of the overall market has to be considered. If the
market is falling fast enough, rising RS may represent a stock
that is falling at a slower rate than the rest.
At this stage of the market I would rather aim for a neutral position, balancing existing long positions with new short entries.
Amcor [AMC]
Last covered on February 12, 2003.
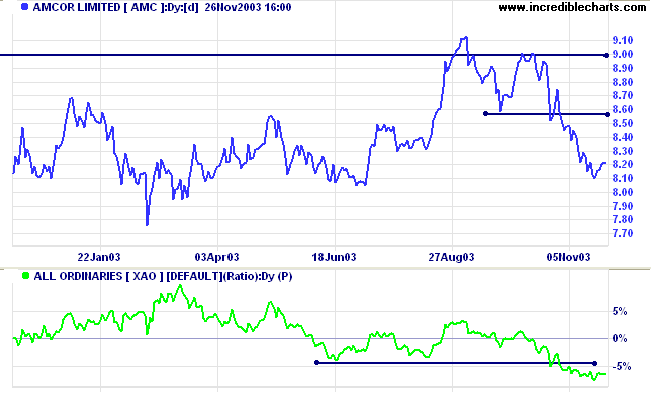
AMC has completed a double top at resistance at 9.00 and now appears to be starting a pull-back to test the new resistance band at 8.50 to 8.57. A strong bear signal will result if price and Relative Strength (xao) both respect the new resistance level.
Last covered on February 12, 2003.
AMC has completed a double top at resistance at 9.00 and now appears to be starting a pull-back to test the new resistance band at 8.50 to 8.57. A strong bear signal will result if price and Relative Strength (xao) both respect the new resistance level.
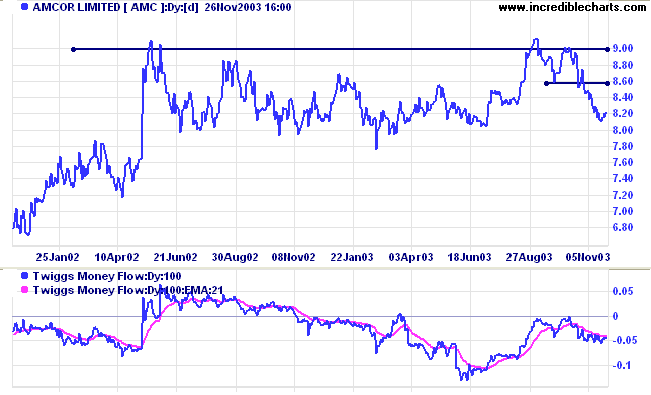
Twiggs Money Flow (100) remains below zero, signaling
distribution, and has now started to fall.
A dry-up of volume and volatility near resistance will be an
encouraging sign for bears.
A rise above 9.00 would be bullish.
Understanding
the Trading Diary has been expanded to offer further
assistance to readers, including directions on how to search the
archives.
Colin Twiggs
Felix qui potuit rerum cognoscere causas.
Happy is he who has been able to learn the cause of things.
~ Virgil.
Happy is he who has been able to learn the cause of things.
~ Virgil.
US charts
Our server switch-over has taken longer than expected.
We are now in the final stages of the setup.
Back Issues
You can now view back issues at the Daily Trading Diary Archives.
Back Issues
Access the Trading Diary Archives.