Early Morning update
In future an early edition of the Trading Diary (sans US charts)
will be available on the website and emailed at 7:00 a.m. (Sydney time).
A later US market update will be emailed around midday.
In future an early edition of the Trading Diary (sans US charts)
will be available on the website and emailed at 7:00 a.m. (Sydney time).
A later US market update will be emailed around midday.
Trading Diary
November 24, 2003
These extracts from my daily trading diary are
for educational purposes and should not be interpreted as
investment advice. Full terms and conditions can be found at
Terms
of Use .
USA
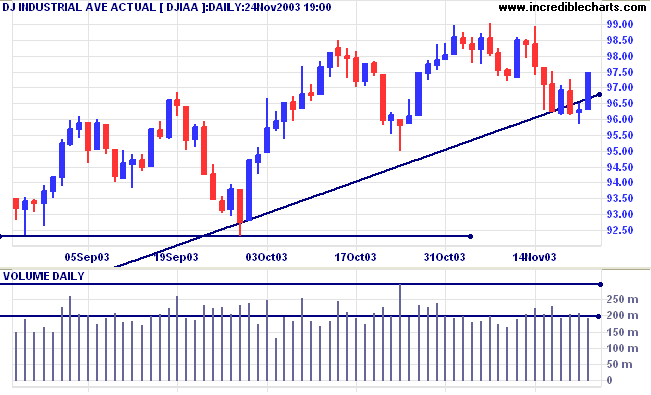
The Dow Industrial Average rallied more than 1% to test
short-term resistance at 9750, Tuesday's high. The index closed
at 9748.
The intermediate trend is down. Expect support at 9500 and 9230.
The primary trend is up. A fall below support at 9000 will signal reversal.
The intermediate trend is down. Expect support at 9500 and 9230.
The primary trend is up. A fall below support at 9000 will signal reversal.
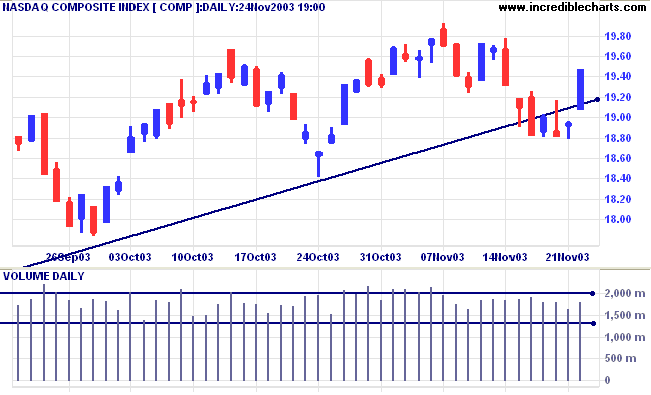
The Nasdaq Composite jumped 53 points to close at 1947 on higher
volume; above short-term resistance at 1923 (November 11 low).
The index is likely to test the stronger resistance level at 1980
(November 14 high).
The intermediate trend is down. Expect support at 1840 and 1780.
The primary trend is up. A fall below support at 1640 will signal reversal.
The intermediate trend is down. Expect support at 1840 and 1780.
The primary trend is up. A fall below support at 1640 will signal reversal.
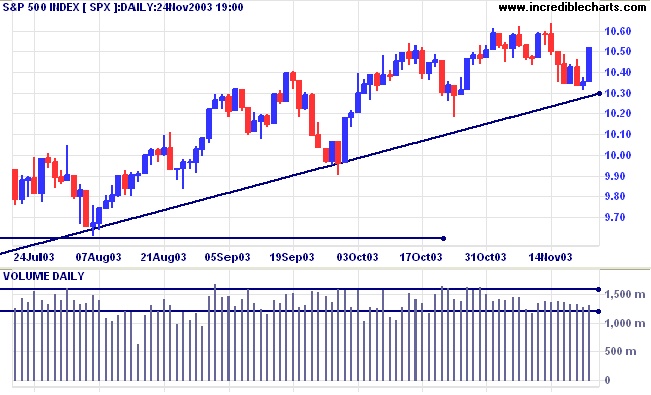
The S&P 500 rallied to break through early resistance, headed
for a test of 1064, the November 14th high. The index closed
up 17 points at 1052. Average volume signals a lack of commitment
from buyers.
The intermediate trend is down.
Short-term: Bullish if the S&P500 is above the high of 1064. Bearish below 1034 (Tuesday's low).
The intermediate trend is down.
Short-term: Bullish if the S&P500 is above the high of 1064. Bearish below 1034 (Tuesday's low).
The primary trend is up. A fall below 960 will signal
reversal.
Intermediate: Bullish above 1064.
Long-term: Bullish above 960.
Intermediate: Bullish above 1064.
Long-term: Bullish above 960.
The Chartcraft NYSE Bullish % Indicator increased
slightly to 79.87% (November 24).
Dollar rebound
The dollar recovered against the yen and euro on thin pre-holiday trade. (more)
Treasury yields
The yield on 10-year treasury notes gapped up to 4.23%, a bullish sign.
The intermediate trend is down after bearish equal highs below a higher peak.
The primary trend is up.
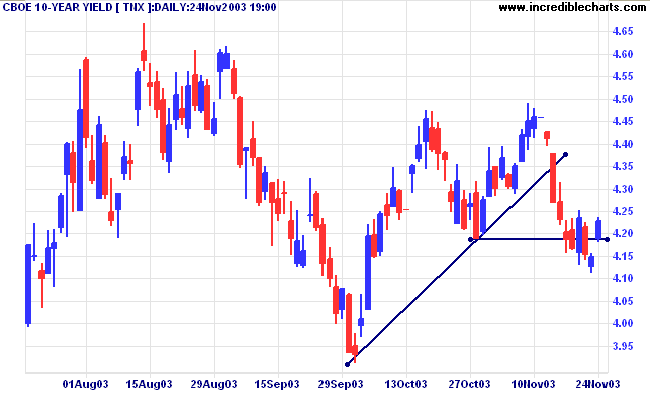
The yield on 10-year treasury notes gapped up to 4.23%, a bullish sign.
The intermediate trend is down after bearish equal highs below a higher peak.
The primary trend is up.
Gold
New York (20.13): Spot gold retreated to $391.40.
The intermediate trend is up.
The primary trend is up. Expect resistance at 400 to 415.
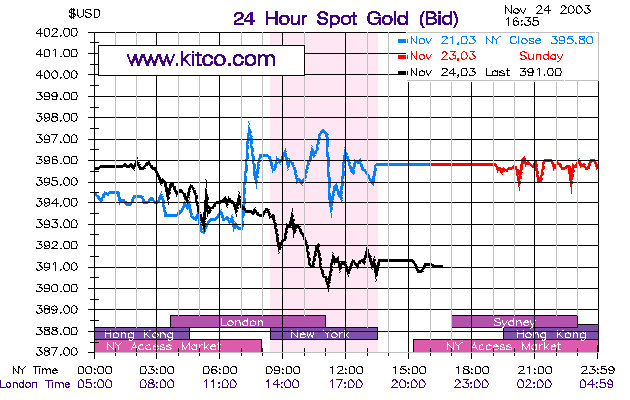
New York (20.13): Spot gold retreated to $391.40.
The intermediate trend is up.
The primary trend is up. Expect resistance at 400 to 415.
ASX Australia
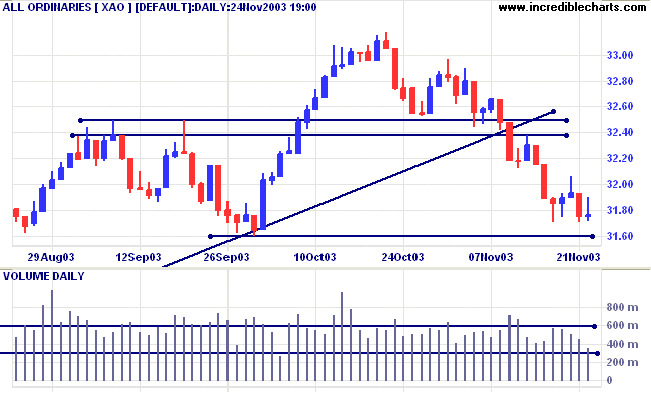
The All Ordinaries closed 1 point higher at 3176. The long upper
shadow and lower volume are bearish and we should see a test of
the major 3160 support level. This may be ameliorated after the
strong overnight performance of the US markets.
The intermediate trend is down.
MACD (26,12,9) is below its signal line; Slow Stochastic (20,3,3) has whipsawed back below its signal line.
Short-term: Bullish if the All Ords rises above Thursday's high of 3206. Bearish below Thursday's low of 3189.
MACD (26,12,9) is below its signal line; Slow Stochastic (20,3,3) has whipsawed back below its signal line.
Short-term: Bullish if the All Ords rises above Thursday's high of 3206. Bearish below Thursday's low of 3189.
XAO is below the long-term trendline, signaling weakness. The
primary trend is up but will reverse if there is a fall below
3160 (October 1).
Twiggs Money Flow (100) signals distribution after a bearish triple divergence.
Intermediate term: Bullish above 3250. Bearish below 3160.
Long-term: Bearish below 3160.
Twiggs Money Flow (100) signals distribution after a bearish triple divergence.
Intermediate term: Bullish above 3250. Bearish below 3160.
Long-term: Bearish below 3160.
Wattyl [WYL]
Last covered on March 12, 2003.
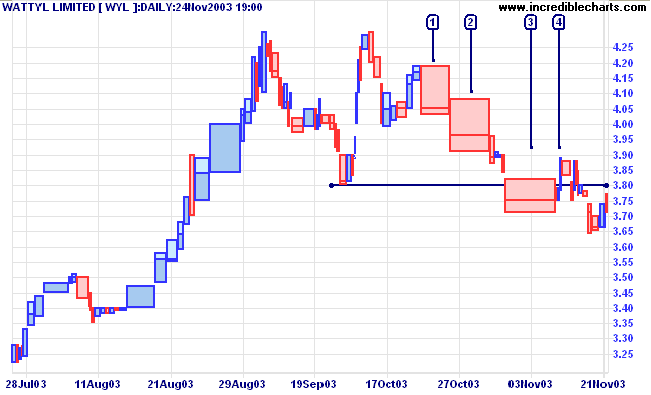
WYL has broken downwards after a September-October double top and appears headed for a test of the primary supporting trendline. Twiggs Money Flow (100) is bearish after a sharp fall below the previous low.
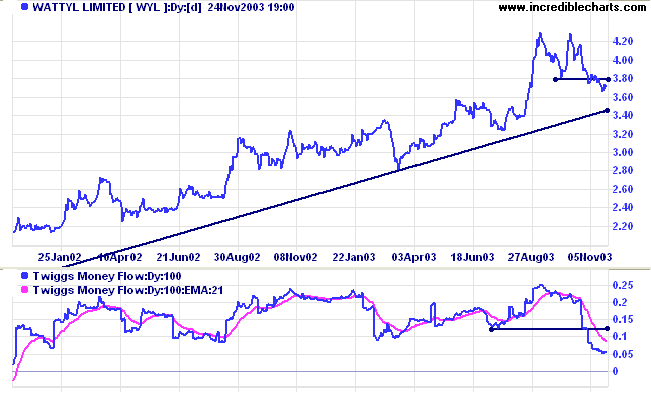
Last covered on March 12, 2003.
WYL has broken downwards after a September-October double top and appears headed for a test of the primary supporting trendline. Twiggs Money Flow (100) is bearish after a sharp fall below the previous low.
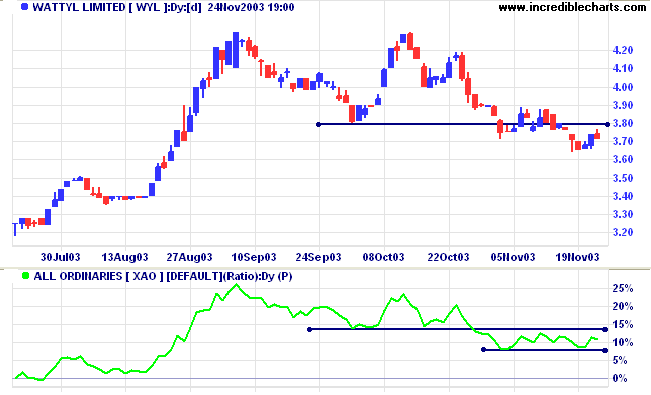
Relative Strength (xao) has declined and a fall below the
November 4th RS low would add further confirmation.
Selling pressure is signaled by large volume at [1] and [2].
Buying support at 3.80 was overcome with further large volume at
[3]. Subsequent price action is on thin volume. A successful test
of the 3.80 resistance level, on low volume and volatility, will
be a strong bear signal.
Understanding
the Trading Diary has been expanded to offer further
assistance to readers, including directions on how to search the
archives.
Colin Twiggs
Advice is like snow; the softer it falls, the
longer it dwells upon,
and the deeper it sinks into the mind.
~ Samuel Coleridge.
and the deeper it sinks into the mind.
~ Samuel Coleridge.
US charts
Our server switch-over has taken longer than expected
but we are now in the final stages of the setup.
Back Issues
You can now view back issues at the Daily Trading Diary Archives.
Back Issues
Access the Trading Diary Archives.