
Trading Diary
November 20, 2003
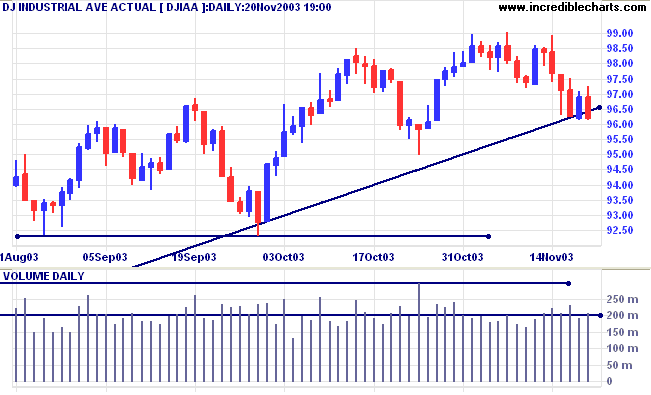
The intermediate trend is down.
The primary trend is up. A fall below 9000 will signal reversal.
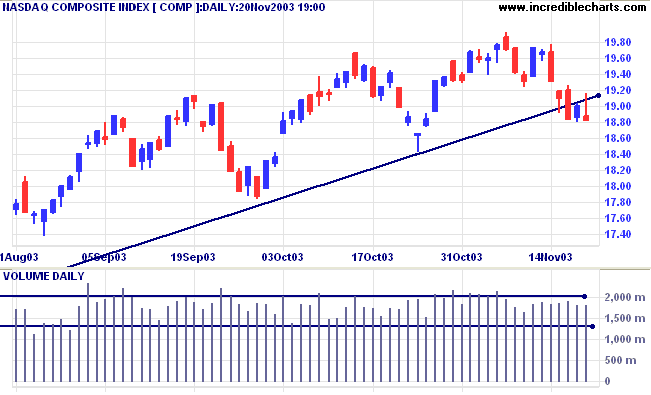
The intermediate trend is down. Expect support at 1840 and 1780, the previous two lows.
The primary trend is up. A fall below 1640 will signal reversal.
The intermediate trend is down. Expect support at the primary trendline.
Short-term: Bullish if the S&P500 is above 1062, the high of the November 7th. Bearish below 1034 (Wednesday's low).
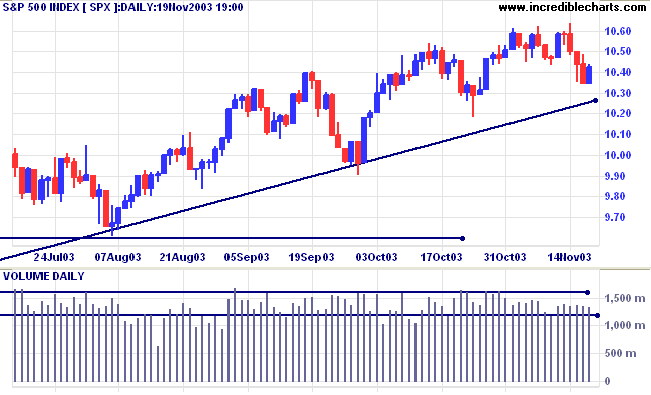
Twiggs Money Flow (100) signals distribution.
Intermediate: Bullish above 1062.
Long-term: Bullish above 960.
Powerful explosions damaged the British Consulate and HSBC Bank in Istanbul, killing 27, including the British Consul General, and injuring more than 450. (more)
355,000 new unemployment claims were filed last week, below the 370,000 from the week before. (more)
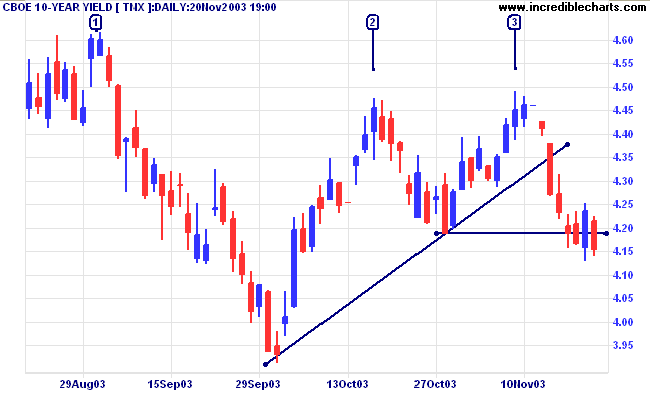
No false break, the yield on 10-year treasury notes closed back down at 4.15%.
The intermediate trend is down.
The primary trend is up.
New York (19:24): Spot gold retreated to $394.40.
The intermediate trend is up.
The primary trend is up. Expect resistance at 400 to 415.
|
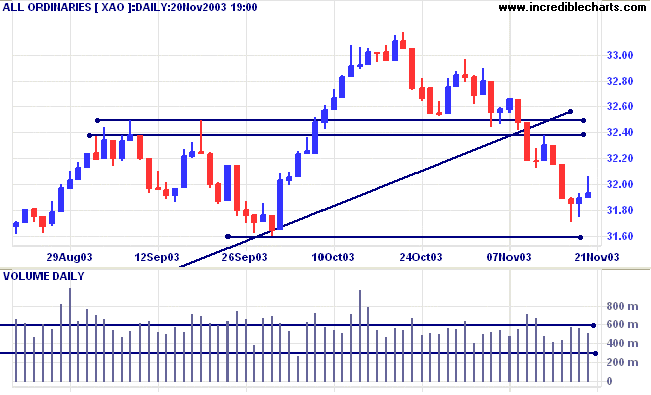
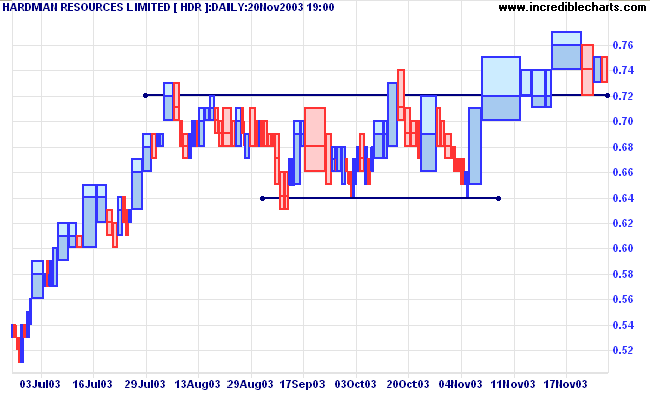
A reader asked: "What are the two lines that you draw on
the volume chart?" This is an idea from Bill McLaren. Draw the lines to incorporate about 80% of volume readings. Volume above the higher line signals unusually strong volume. Volume below the lower line signals unusually low volume. Both are important signals. |
MACD (26,12,9) is below its signal line; Slow Stochastic (20,3,3) has whipsawed above.
Short-term: Bullish if the All Ords crosses back above resistance at 3250. Bearish below Thursday's low of 3189.
Intermediate term: Bullish above 3250. Bearish below 3160.
Long-term: Bearish below 3160.
Last covered on July 21, 2003.
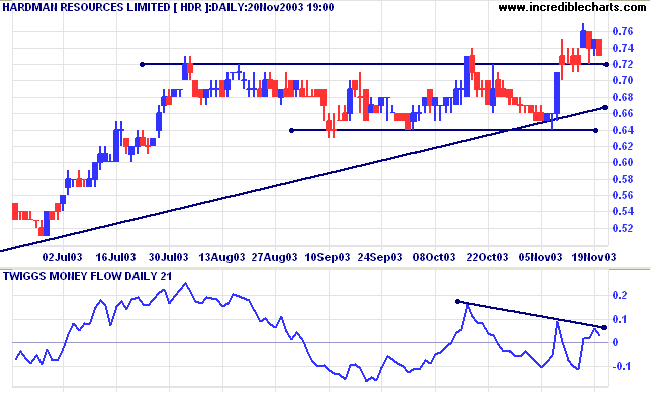
HDR consolidated between 0.64 and 0.72 after an inverted head and shoulders reversal. Price broke through resistance last week, accompanied by rising Relative Strength (xao).
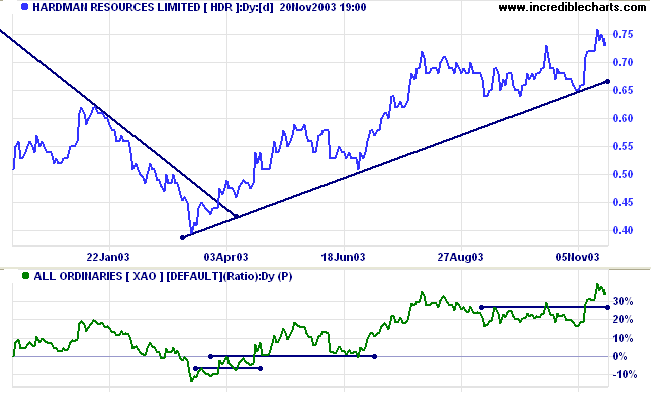
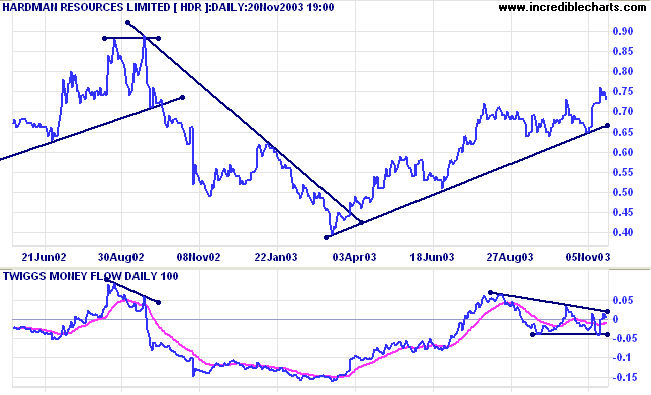
A pull-back that respects support at 0.72 will be bullish, but I will wait for a more positive signal from Twiggs Money Flow.
It seems that the U.S. financial system is bound and determined to find out.
~ John P Hussman: Freight Trains and Steep Curves (July 11, 2003).
Use the Search function at the top of any
(Incredible Charts) website page:
EXAMPLE
HINT |
You can now view back issues at the Daily Trading Diary Archives.
Back Issues

Author: Colin Twiggs is a former investment banker with almost 40 years of experience in financial markets. He co-founded Incredible Charts and writes the popular Trading Diary and Patient Investor newsletters.
Using a top-down approach, Colin identifies key macro trends in the global economy before evaluating selected opportunities using a combination of fundamental and technical analysis.
Focusing on interest rates and financial market liquidity as primary drivers of the economic cycle, he warned of the 2008/2009 and 2020 bear markets well ahead of actual events.
He founded PVT Capital (AFSL No. 546090) in May 2023, which offers investment strategy and advice to wholesale clients.