|
ETOs and
Warrants We are making progress. ETOs and warrants will be available shortly. US stocks to follow. |
Trading Diary
October 2, 2003
These extracts from my daily trading diary
are for educational purposes
and should not be interpreted as investment
advice. Full terms and conditions can be found at Terms
of Use .
USA
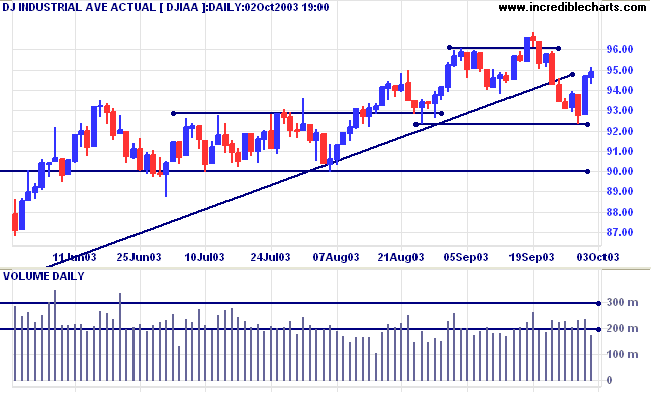
After Wednesday's sharp rally, the Dow Industrial Average
consolidated, closing slightly up at 9488 on low volume.
The intermediate trend is still down.
The index is below the upward trendline, signaling primary trend weakness. A fall below 9000 will signal reversal.
The intermediate trend is still down.
The index is below the upward trendline, signaling primary trend weakness. A fall below 9000 will signal reversal.
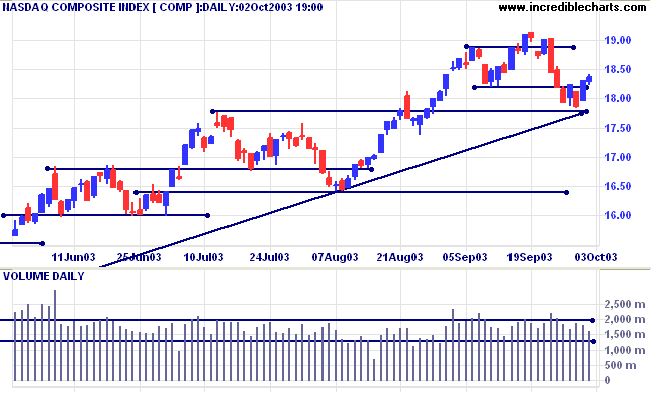
The Nasdaq Composite made a similar consolidation, closing up 4
points at 1836 on average volume.
The intermediate trend is down.
The primary trend is up. Price appears headed for a re-test of the supporting trendline. A fall below 1640 will signal reversal.
The intermediate trend is down.
The primary trend is up. Price appears headed for a re-test of the supporting trendline. A fall below 1640 will signal reversal.
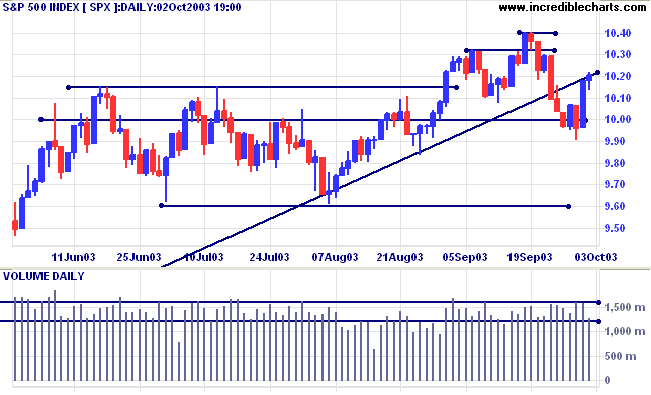
The S&P 500 rallied 22 points to close at 1018 on lower
volume.
The intermediate down-trend is weak.
The primary trend is up. The trendline has been broken, signaling weakness. A fall below 960 will signal reversal.
The intermediate down-trend is weak.
The primary trend is up. The trendline has been broken, signaling weakness. A fall below 960 will signal reversal.
The Chartcraft NYSE Bullish % Indicator rallied
to 78.95% (October 2).
Market Strategy
Short-term: Bearish below 1013. Bullish above 1040.
Intermediate: Bearish below 960. Bullish above 1040.
Long-term: Bullish above 960.
Short-term: Bearish below 1013. Bullish above 1040.
Intermediate: Bearish below 960. Bullish above 1040.
Long-term: Bullish above 960.
Jobless claims rise
New unemployment claims increased to 399,000 from a revised 386,000 in the previous week. (more)
New unemployment claims increased to 399,000 from a revised 386,000 in the previous week. (more)
Treasury yields
The yield on 10-year treasury notes rose slightly to 4.01%, after 2 days below support at 4.00%.
The intermediate trend is down.
The primary trend is up.
The yield on 10-year treasury notes rose slightly to 4.01%, after 2 days below support at 4.00%.
The intermediate trend is down.
The primary trend is up.
Gold
New York (17:30): Spot gold eased to $382.30.
The primary trend is up. Expect heavy resistance between 400 and 415 (the 10-year high).
New York (17:30): Spot gold eased to $382.30.
The primary trend is up. Expect heavy resistance between 400 and 415 (the 10-year high).
ASX Australia
Confirming the influence of the US markets over the All
Ordinaries, the local index rallied 38 points to close at 3203 on
strong volume. Expect resistance at 3214 and 3250.
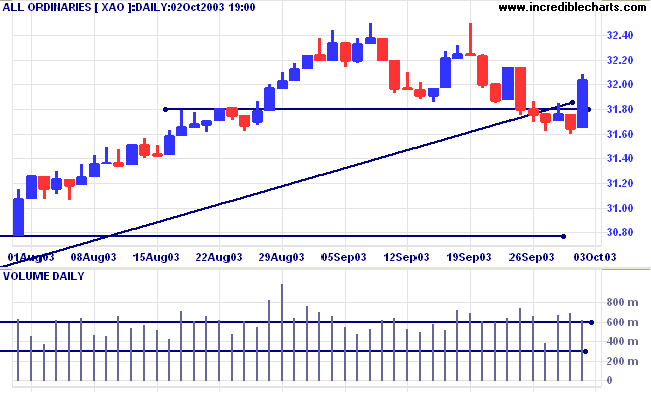
The intermediate trend is down.
The primary trend is up. A fall below 3000 will signal reversal.
MACD (26,12,9) is below its signal line; Slow Stochastic (20,3,3) has crossed to above;
Twiggs Money Flow (21) signals distribution.
The primary trend is up. A fall below 3000 will signal reversal.
MACD (26,12,9) is below its signal line; Slow Stochastic (20,3,3) has crossed to above;
Twiggs Money Flow (21) signals distribution.
Market Strategy
Short-term: Bullish if the All Ords is above 3250. Bearish below 3160.
Intermediate: Bullish above 3250.
Long-term: Bullish above 3000.
Short-term: Bullish if the All Ords is above 3250. Bearish below 3160.
Intermediate: Bullish above 3250.
Long-term: Bullish above 3000.
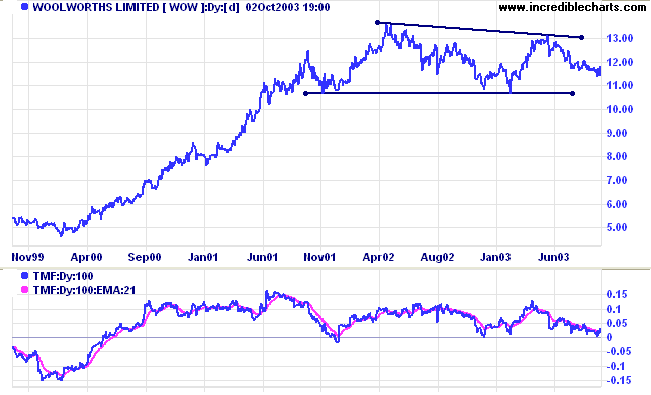
Woolworths [WOW]
Last covered on July 24, 2003.
Woolworths has formed a broad stage 3 top. Twiggs Money Flow (100) threatens to cross below zero. MACD is bearish.
Last covered on July 24, 2003.
Woolworths has formed a broad stage 3 top. Twiggs Money Flow (100) threatens to cross below zero. MACD is bearish.
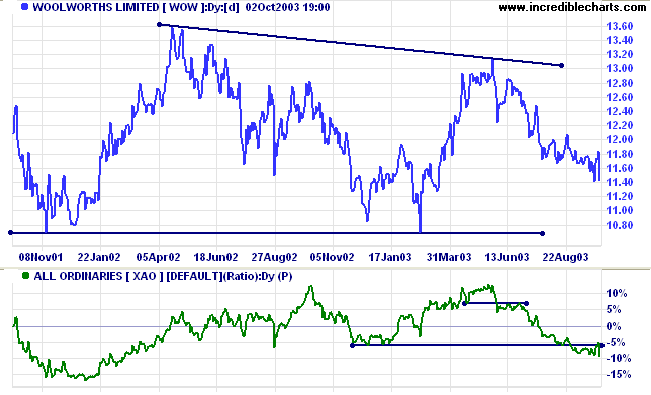
Relative Strength (price ratio: xao) has fallen to a new 6-month
low, signaling primary weakness.
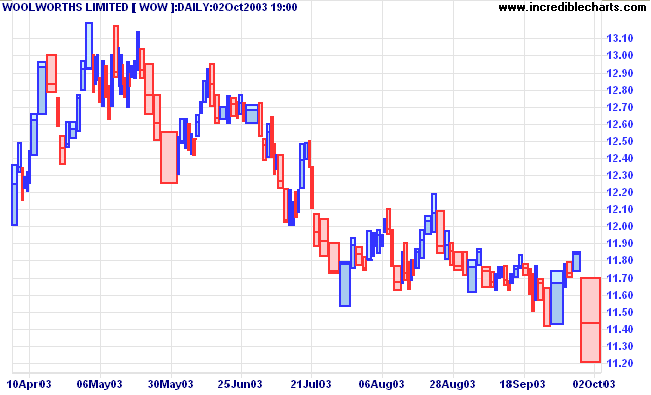
The latest bar on the equivolume chart signals buying support,
with strong volume and a weak close. A fall below 11.40 will
signal further weakness.
A close below 10.70 will be a strong bear signal. The
target is 7.80 (10.70 - (13.60 - 10.70)).
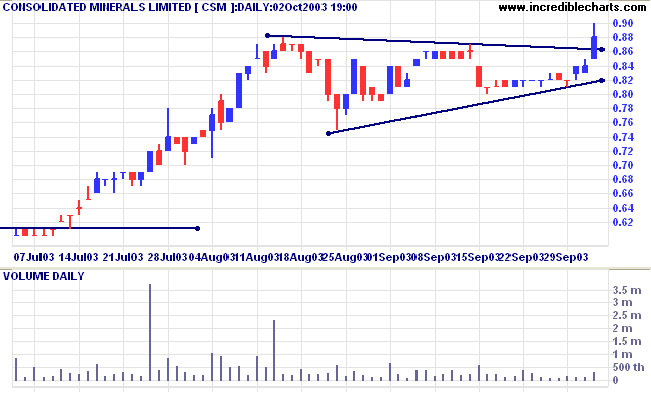
Consolidated Minerals [CSM]
An ASX 300 stock, CSM broke out of a broad consolidation, rallying strongly before forming a triangle pattern. Twiggs Money Flow (100) signals accumulation. MACD has formed a bullish trough above zero.
An ASX 300 stock, CSM broke out of a broad consolidation, rallying strongly before forming a triangle pattern. Twiggs Money Flow (100) signals accumulation. MACD has formed a bullish trough above zero.
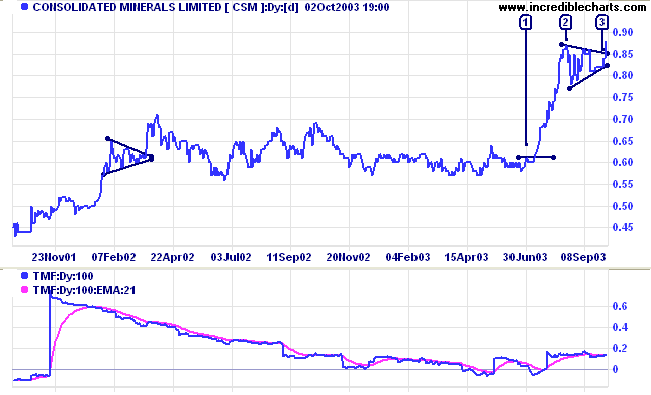
Triangles are generally continuation patterns in an up-trend,
commonly occurring at the mid-point in an up-trend. So the target
is measured from the previous breakout point [1] to the highest
point of the triangle [2] and then projected upwards from the
breakout [3]. In this example, the target would be 1.11 (0.85 +
0.87 - 0.61). I prefer to measure from the closing price, rather
than the high or low.
Relative Strength has formed a similar pattern.
Relative Strength has formed a similar pattern.
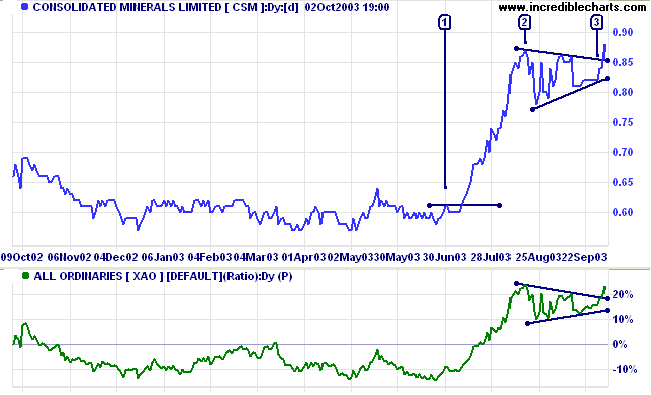
There is no significant increase in daily volume at the breakout,
a sign of weakness. We may well see a pull-back to re-test
support before the stock makes further gains.
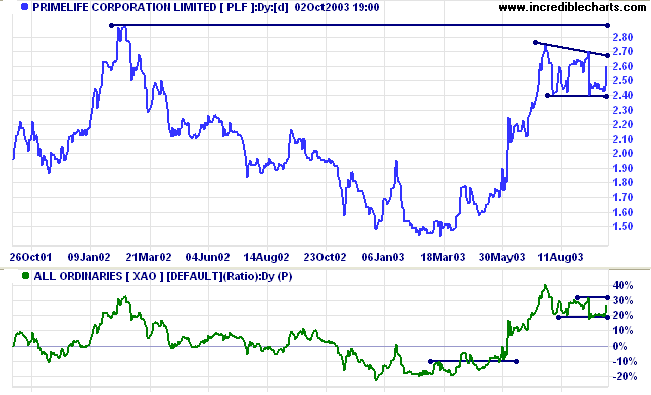
Primelife [PLF]
Another ASX 300 stock shows a similar mid-point consolidation after a strong rally. But there is one major difference: overhead resistance at 2.90. The target should be adjusted accordingly.
Another ASX 300 stock shows a similar mid-point consolidation after a strong rally. But there is one major difference: overhead resistance at 2.90. The target should be adjusted accordingly.
Skilled Engineering [SKE]
SKE has corrected sharply after a healthy rally off the long-term trendline. We are likely to see a re-test of the supporting trendline. Short-term and intermediate traders may find long opportunities if volume and volatility dry up, or there is a strong reversal signal, at the trendline.
SKE has corrected sharply after a healthy rally off the long-term trendline. We are likely to see a re-test of the supporting trendline. Short-term and intermediate traders may find long opportunities if volume and volatility dry up, or there is a strong reversal signal, at the trendline.
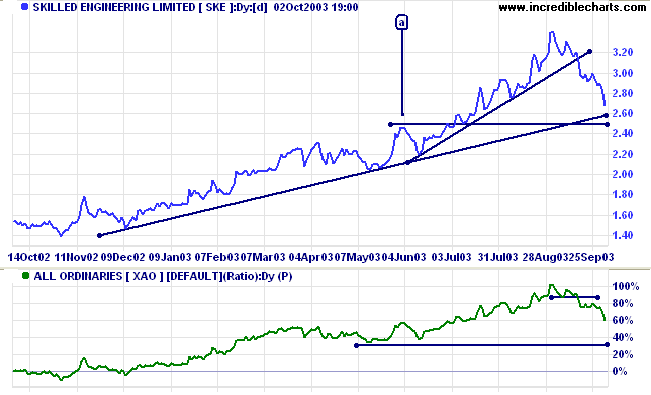
The test of the trendline and the high of the previous peak [a]
often coincide, reinforcing the support level. Where they do not,
as in the above chart, there may well be a break of the
trendline. But long opportunities may well present themselves at
the 2.50 support level.
A close below 2.50 will be bearish, while a close below 2.00 would signal reversal of the primary trend.
A close below 2.50 will be bearish, while a close below 2.00 would signal reversal of the primary trend.
Understanding
the Trading Diary has been expanded to offer further
assistance to readers, including
directions on how to search the archives.
Colin Twiggs
Sincere words are not showy;
Showy words are not sincere.
Those who know are not "widely learned";
Those "widely learned" do not know.
The good do not have a lot;
Those with a lot are not good.
~ Lao Tse.
Showy words are not sincere.
Those who know are not "widely learned";
Those "widely learned" do not know.
The good do not have a lot;
Those with a lot are not good.
~ Lao Tse.
Format Charts: Bar sizes
|
To alter the width of the price bars,
separately from other indicators: (1) select Format Charts >> Indicator Width >> Set Candle/OHLC/Parabolic SAR Width; (2) enter a value between 1 and 5 in the pop-up box; (3) click OK. I have set the All Ordinaries chart above as an example: Indicator Width is 2, but Candle Width is set at 3. Note the difference between the price and volume bars on the chart. |
Back Issues
You can now view back issues at the Daily Trading Diary Archives.
You can now view back issues at the Daily Trading Diary Archives.
Back Issues
Access the Trading Diary Archives.

Author: Colin Twiggs is a former investment banker with almost 40 years of experience in financial markets. He co-founded Incredible Charts and writes the popular Trading Diary and Patient Investor newsletters.
Using a top-down approach, Colin identifies key macro trends in the global economy before evaluating selected opportunities using a combination of fundamental and technical analysis.
Focusing on interest rates and financial market liquidity as primary drivers of the economic cycle, he warned of the 2008/2009 and 2020 bear markets well ahead of actual events.
He founded PVT Capital (AFSL No. 546090) in May 2023, which offers investment strategy and advice to wholesale clients.