| Searching the Trading Diary Archives |
Use the normal Search function at the top
of the website page:
EXAMPLE |
Trading Diary
July 24, 2003
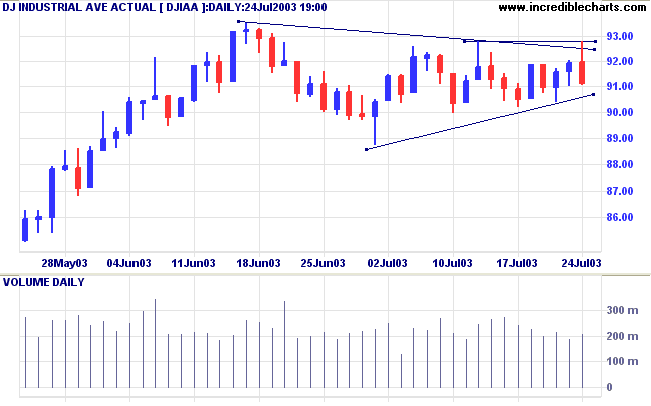
The intermediate trend is up. A fall below 8968 will signal a reversal.
The primary trend is up.
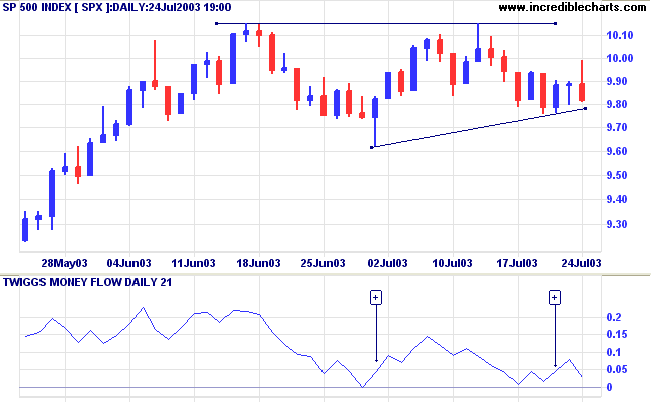
The intermediate trend has turned down. MACD shows a bearish divergence but Twiggs Money Flow (21) completed a bullish trough above zero.
The primary trend is up.
The intermediate trend is up. A fall below 1675 will signal a reversal.
The primary trend is up.
Short-term: Long if the S&P500 is above 1000. Short if below 975.
Intermediate: Long if S&P 500 is above 1015. Short if below 962.
Long-term: Long.
New unemployment claims fell to 386,000 last week, below the benchmark 400,000 level. (more)
The yield on 10-year notes [TNX] edged higher to 4.17%.
The intermediate trend is up; the primary trend is down.
New York (17.02): Spot gold has leveled off at $361.30.
The primary trend is up.
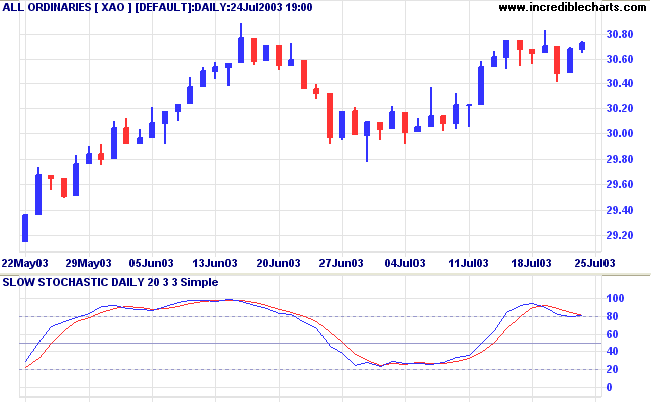
The intermediate trend is up. A fall below support at 2979 would signal a reversal.
The primary trend is up (marginally).
Slow Stochastic (20,3,3) has crossed to above its signal line; MACD (26,12,9) is above; Twiggs Money Flow signals accumulation.
Short-term: Long if the All Ords is above 3083; short if below 3041.
Intermediate: Long if the index is above 3083; short if below 2979.
Long-term: Long if above 2979.
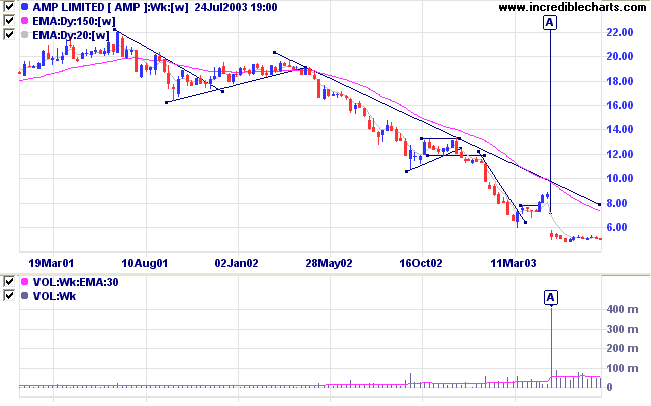
AMP Limited [AMP] experienced a severe shakeout at [a] on huge volume. Shakeouts often precede a stage 1 base and, although well below the 150-day moving average, the stock appears to be no exception. I suspect that it will be quite some time before we witness a breakout to stage 2 but the months ahead may present several intermediate rallies for shorter-term traders. The immediate target would be 6.00, with some rallies possibly reaching 9.00. Stops should be kept tight to protect against further downside.
Never "double up"; that is, never completely and at once reverse a position.
Being "long", for instance, do not "sell out" and go as much "short".
This may occasionally succeed but is very hazardous, for should the market begin again to advance,
the mind reverts to its original opinion and the speculator "covers up" and "goes long" again.
Should this last change be wrong, complete demoralization ensues.
The change in the original position should have been made moderately, cautiously,
thus keeping the judgment clear and preserving the balance of mind.
~ S.A. Nelson: The ABC of Stock Speculation (1903).
|
Stock Screens: Trending Stocks |
|
Another method of identifying trending
stocks uses the Bollinger Bands filter: |
You can now view back issues at the Daily Trading Diary Archives.
Back Issues

Author: Colin Twiggs is a former investment banker with almost 40 years of experience in financial markets. He co-founded Incredible Charts and writes the popular Trading Diary and Patient Investor newsletters.
Using a top-down approach, Colin identifies key macro trends in the global economy before evaluating selected opportunities using a combination of fundamental and technical analysis.
Focusing on interest rates and financial market liquidity as primary drivers of the economic cycle, he warned of the 2008/2009 and 2020 bear markets well ahead of actual events.
He founded PVT Capital (AFSL No. 546090) in May 2023, which offers investment strategy and advice to wholesale clients.