|
ETOs and
Warrants We are making progress. ETOs and warrants will be available shortly. US stocks to follow. |
Trading Diary
October 1, 2003
These extracts from my daily trading diary
are for educational purposes
and should not be interpreted as investment
advice. Full terms and conditions can be found at Terms
of Use .
USA
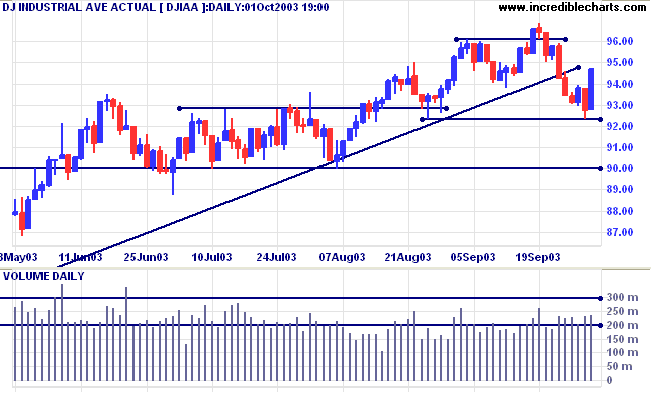
The Dow Industrial Average rallied 2.1% to close at 9469 on
higher volume.
The intermediate down-trend is weak.
The index is below the upward trendline, signaling primary trend weakness. A fall below 9000 will signal reversal.
The intermediate down-trend is weak.
The index is below the upward trendline, signaling primary trend weakness. A fall below 9000 will signal reversal.
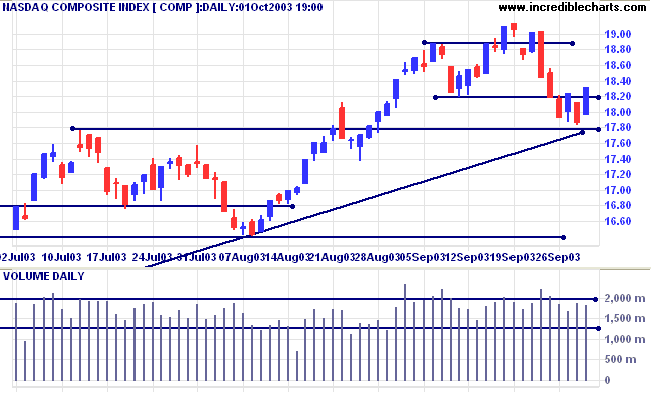
The Nasdaq Composite started an up-swing with a 45 point gain,
closing at 1832 on average volume.
The intermediate trend is down.
The primary trend is up. Price appears headed for a re-test of the supporting trendline. A fall below 1640 will signal reversal.
The intermediate trend is down.
The primary trend is up. Price appears headed for a re-test of the supporting trendline. A fall below 1640 will signal reversal.
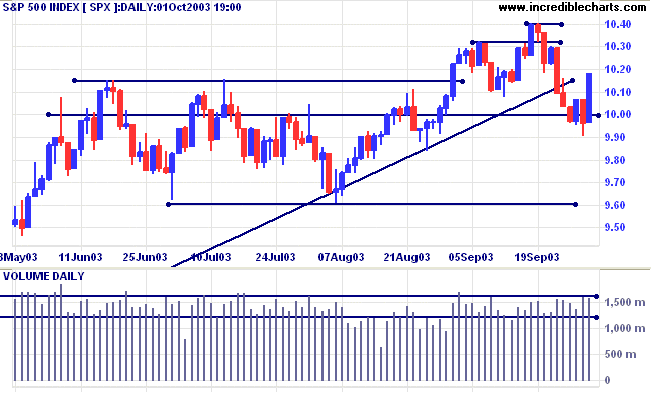
The S&P 500 rallied 22 points to close at 1018 on lower
volume.
The intermediate down-trend is weak.
The primary trend is up. The trendline has been broken, signaling weakness. A fall below 960 will signal reversal.
The intermediate down-trend is weak.
The primary trend is up. The trendline has been broken, signaling weakness. A fall below 960 will signal reversal.
The Chartcraft NYSE Bullish % Indicator rallied
to 78.60% (October 1).
Market Strategy
Short-term: Bearish below 996. Bullish above 1040.
Intermediate: Bullish above 1040. Bearish below 960.
Long-term: Bullish above 1040.
Short-term: Bearish below 996. Bullish above 1040.
Intermediate: Bullish above 1040. Bearish below 960.
Long-term: Bullish above 1040.
Manufacturing slows
The Institute for Supply Management manufacturing index fell to 53.7, from 54.7 in August. (more)
The Institute for Supply Management manufacturing index fell to 53.7, from 54.7 in August. (more)
Treasury yields
The yield on 10-year treasury notes eased lower to 3.93%, below support at 4.00%.
The intermediate trend is down.
The primary trend is up. The fall below 4.00% signals weakness.
The yield on 10-year treasury notes eased lower to 3.93%, below support at 4.00%.
The intermediate trend is down.
The primary trend is up. The fall below 4.00% signals weakness.
Gold
New York (20:02): Spot gold is level at $384.30.
The primary trend is up. Expect heavy resistance between 400 and 415 (the 10-year high).
New York (20:02): Spot gold is level at $384.30.
The primary trend is up. Expect heavy resistance between 400 and 415 (the 10-year high).
ASX Australia
The All Ordinaries closed down 11 points at 3165 on strong
volume. Expect an up-swing after the sharp reversal in US
markets.
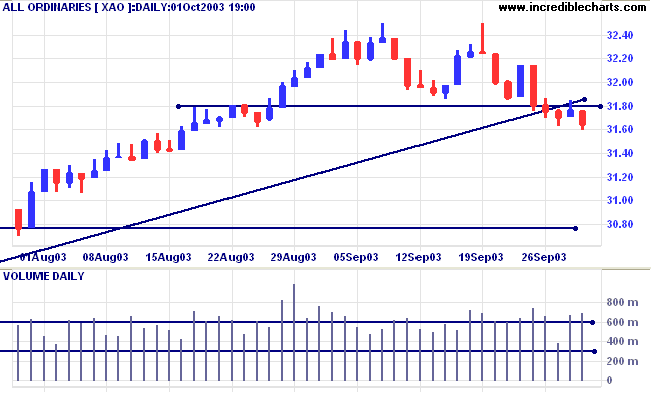
The intermediate down-trend (secondary reaction) continues.
The primary trend is up. A fall below 3000 will signal reversal.
MACD (26,12,9) is below its signal line; Slow Stochastic (20,3,3) has crossed to above;
Twiggs Money Flow (21) signals distribution.
The primary trend is up. A fall below 3000 will signal reversal.
MACD (26,12,9) is below its signal line; Slow Stochastic (20,3,3) has crossed to above;
Twiggs Money Flow (21) signals distribution.
Market Strategy
Short-term: Bullish if the All Ords is above 3250. Bearish below 3162.
Intermediate: Bullish above 3250.
Long-term: Bullish above 3000.
Short-term: Bullish if the All Ords is above 3250. Bearish below 3162.
Intermediate: Bullish above 3250.
Long-term: Bullish above 3000.
Spotless [SPT]
Last covered on August 26, 2003.
SPT rallied strongly off a narrow mid-year bottom. Price broke through resistance at 5.40 but this proved to be a marginal break, with a retreat back below the resistance line. Twiggs Money Flow (100) signals accumulation. MACD is bullish.
Last covered on August 26, 2003.
SPT rallied strongly off a narrow mid-year bottom. Price broke through resistance at 5.40 but this proved to be a marginal break, with a retreat back below the resistance line. Twiggs Money Flow (100) signals accumulation. MACD is bullish.
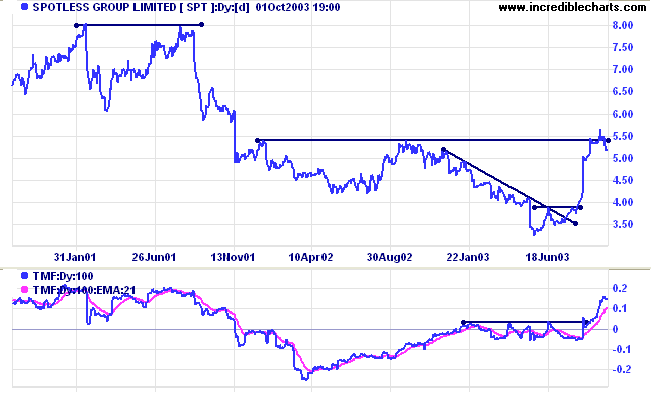
Relative Strength (price ratio: xao) completed a trend change at
[+] but now appears to be weakening.
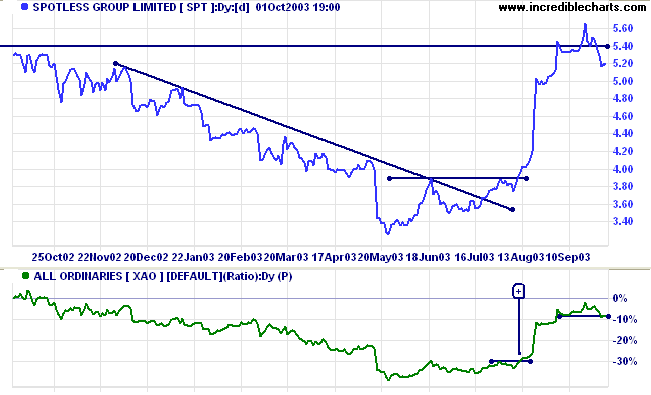
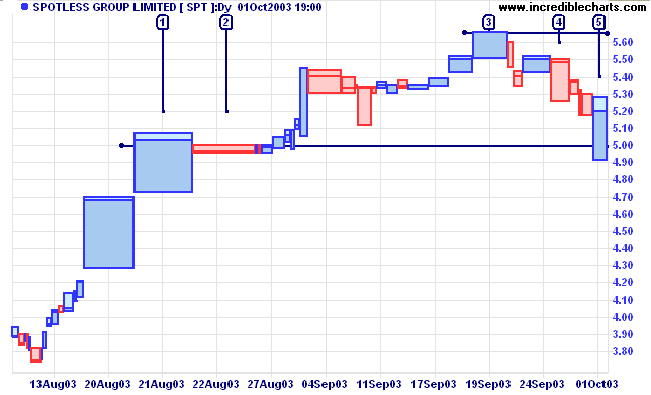
The equivolume chart highlights strong support/resistance at
5.00, with heavy volumes at [1] and [2]. Selling pressure is
evident at [3], with a large square bar. But weak closes at [4]
and [5] signal buying support.
Price may consolidate between 5.00 and 5.66, which would favor an upside breakout.
A close below 5.00 will be bearish.
Price may consolidate between 5.00 and 5.66, which would favor an upside breakout.
A close below 5.00 will be bearish.
Foodland [FOA]
Last covered June 23, 2003.
FOA has formed a broad stage 3 top below resistance at 20.00. Relative Strength (price ratio: xao) started to trend down at [1], an intermediate signal. A fall below the support line from January will warn of a reversal in the primary trend.
Last covered June 23, 2003.
FOA has formed a broad stage 3 top below resistance at 20.00. Relative Strength (price ratio: xao) started to trend down at [1], an intermediate signal. A fall below the support line from January will warn of a reversal in the primary trend.
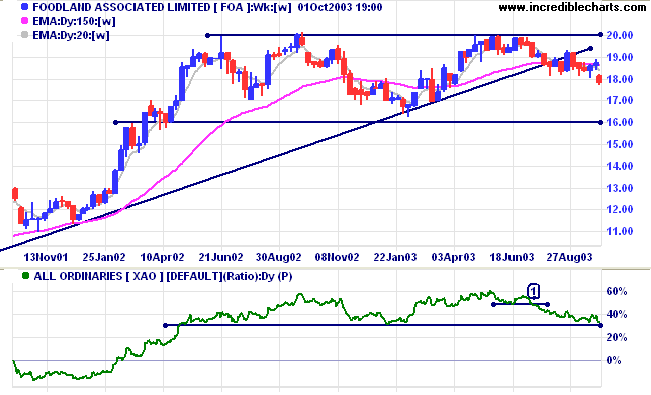
On the price chart, a fall below 16.00 will complete a large
double top pattern, with a target of 12.00.
Understanding
the Trading Diary has been expanded to offer further
assistance to readers, including
directions on how to search the archives.
Colin Twiggs
To know when you have enough is to be
rich.
To go forward with strength is to have ambition.
To not lose your place is to last long.
To die but not be forgotten - that's true long life.
~ Lao Tse.
To go forward with strength is to have ambition.
To not lose your place is to last long.
To die but not be forgotten - that's true long life.
~ Lao Tse.
Format Charts: Bar sizes
|
To change to broader price/indicator
bars, as in the above charts: (1) select Format Charts >> Indicator Width; (2) check the box next to [2]. To alter the width of the price bars separately: (1) select Format Charts >> Indicator Width >> Set Candle/OHLC/Parabolic SAR Width; (2) enter a value between 1 and 5 in the pop-up box; (3) click OK. |
Back Issues
You can now view back issues at the Daily Trading Diary Archives.
You can now view back issues at the Daily Trading Diary Archives.
Back Issues
Access the Trading Diary Archives.

Author: Colin Twiggs is a former investment banker with almost 40 years of experience in financial markets. He co-founded Incredible Charts and writes the popular Trading Diary and Patient Investor newsletters.
Using a top-down approach, Colin identifies key macro trends in the global economy before evaluating selected opportunities using a combination of fundamental and technical analysis.
Focusing on interest rates and financial market liquidity as primary drivers of the economic cycle, he warned of the 2008/2009 and 2020 bear markets well ahead of actual events.
He founded PVT Capital (AFSL No. 546090) in May 2023, which offers investment strategy and advice to wholesale clients.