Incredible Charts
Server
We have managed to reinstate the website and charts
but are still having difficulty with US indexes and hourly updates.
Thanks for your patience.
We have managed to reinstate the website and charts
but are still having difficulty with US indexes and hourly updates.
Thanks for your patience.
Trading Diary
June 23, 2003
These extracts from my daily trading diary are
intended to illustrate the techniques used in short-term trading
and should not be interpreted as investment advice. Full terms
and conditions can be found at Terms
of Use .
USA
The Dow fell 1.4% to 9072, on reassuringly lower volume. The index is headed for a re-test of the 9000 support level.
The intermediate trend is up.
The primary up-trend is up.
The Dow fell 1.4% to 9072, on reassuringly lower volume. The index is headed for a re-test of the 9000 support level.
The intermediate trend is up.
The primary up-trend is up.
The S&P 500 closed 14 points down at 981.
The intermediate trend is up. The break of the trendline and 1000 support level signals weakness.
The primary trend is up.
The intermediate trend is up. The break of the trendline and 1000 support level signals weakness.
The primary trend is up.
The Nasdaq Composite fell 2.0% to close at 1610.
The intermediate trend is up.
The index is in a primary up-trend.
The intermediate trend is up.
The index is in a primary up-trend.
The Chartcraft NYSE Bullish % Indicator is fell
0.72% to 74.50% on June 23.
Market Strategy
Short-term: Long if the S&P 500 is above 995.
Intermediate: Long if the S&P is above 1000.
Long-term: Long.
Intermediate: Long if the S&P is above 1000.
Long-term: Long.
Fed rate cut?
There is a general belief that the Fed will cut rates at its Wednesday policy meeting; by either a quarter or a half per cent. (more)
There is a general belief that the Fed will cut rates at its Wednesday policy meeting; by either a quarter or a half per cent. (more)
Gold
New York (23.40): Spot gold fell sharply to $US 353.90.
On the five-year chart gold is above the long-term upward trendline.
New York (23.40): Spot gold fell sharply to $US 353.90.
On the five-year chart gold is above the long-term upward trendline.
ASX Australia
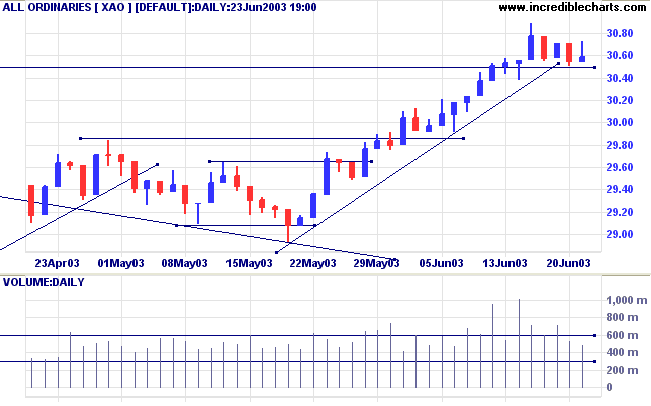
The All Ordinaries rallied during the day but closed weakly; up 4
points at 3059. Volume is reassuringly low. Expect a further test
of the 3050 support level.
The intermediate trend is up.
The primary trend is up.
The monthly Coppock indicator has turned up below zero, signaling the start of a bull market.
Twiggs Money Flow (100) signals accumulation.
MACD (26,12,9) is above its signal line; Slow Stochastic (20,3,3) is below; and Twiggs Money Flow (21) signals accumulation.
Market Strategy
Short-term: Long if the All Ords is above 3073.
Intermediate: The primary trend has reversed up; Long if the All Ords is above 3073.
Long-term: The primary trend reversal has confirmed the March 18 follow through signal. Long.
Intermediate: The primary trend has reversed up; Long if the All Ords is above 3073.
Long-term: The primary trend reversal has confirmed the March 18 follow through signal. Long.
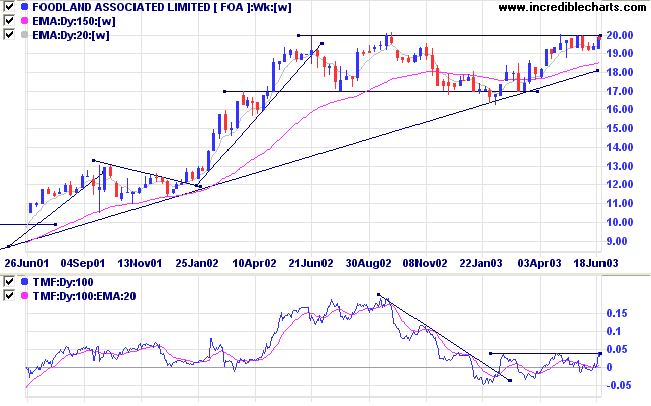
Foodland [FOA]
Foodland is forming a bullish consolidation just below resistance at 20.00
Twiggs Money Flow (100-day) signals accumulation
Relative Strength (price ratio: xao) is below its May 2003 peak.
Foodland is forming a bullish consolidation just below resistance at 20.00
Twiggs Money Flow (100-day) signals accumulation
Relative Strength (price ratio: xao) is below its May 2003 peak.
MACD (26,12,9) is has completed a bullish trough above zero [+].
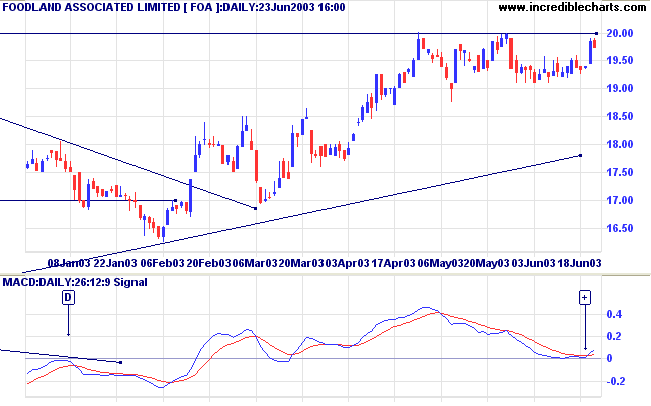
Overhead resistance is at 20.00; support is at 19.00.
Rallies at [1] and [4] were on thin volume, unlikely to break through resistance.
Weak closes at [2] and [6] signal strong support.
Big volume at [7] indicates renewed interest from buyers.
Rallies at [1] and [4] were on thin volume, unlikely to break through resistance.
Weak closes at [2] and [6] signal strong support.
Big volume at [7] indicates renewed interest from buyers.
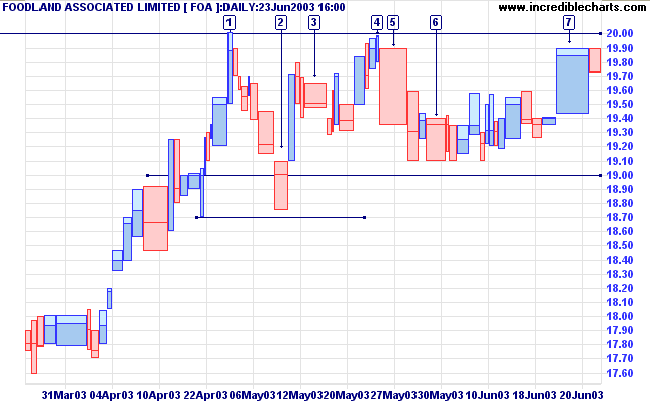
A dry-up of volume on the next pull-back will be a bullish
signal.
A break above 20.00 on strong volume will be a strong bull signal.
A fall below 19.00 would be bearish.
A break above 20.00 on strong volume will be a strong bull signal.
A fall below 19.00 would be bearish.
Understanding
the Trading Diary has been expanded to offer further
assistance to readers.
Colin Twiggs
A failure is a man who has blundered, but is not
able to cash in on the experience.
~ Elbert Hubbard (1856 - 1915).
~ Elbert Hubbard (1856 - 1915).
Use the back/forward arrows on the toolbar
to scroll back/forward on the time scale.
Click the center button to return to the start position.
Back Issues
Click here to access the Daily Trading Diary Archives.
Click here to access the Daily Trading Diary Archives.
Back Issues
Access the Trading Diary Archives.

Author: Colin Twiggs is a former investment banker with almost 40 years of experience in financial markets. He co-founded Incredible Charts and writes the popular Trading Diary and Patient Investor newsletters.
Using a top-down approach, Colin identifies key macro trends in the global economy before evaluating selected opportunities using a combination of fundamental and technical analysis.
Focusing on interest rates and financial market liquidity as primary drivers of the economic cycle, he warned of the 2008/2009 and 2020 bear markets well ahead of actual events.
He founded PVT Capital (AFSL No. 546090) in May 2023, which offers investment strategy and advice to wholesale clients.