|
ETOs and
Warrants ETOs and warrants will be available shortly. US stocks will follow. I repeat this, as much to keep us focused on the task as for any other reason. |
Trading Diary
September 25, 2003
These extracts from my daily trading diary
are for educational purposes
and should not be interpreted as investment
advice. Full terms and conditions can be found at Terms
of Use .
USA
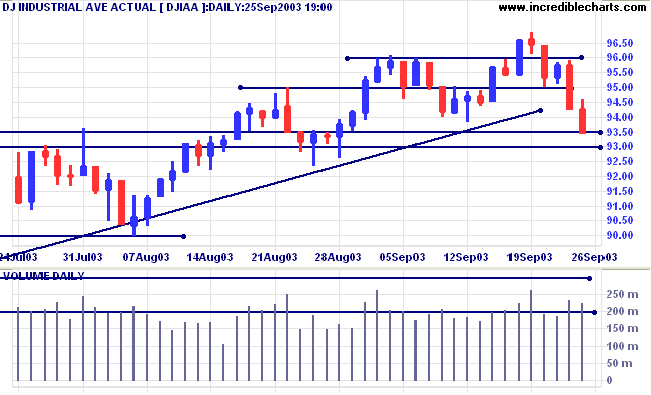
The Dow Industrial Average broke through support at 9381 and
closed at 9344 on lower volume. The index has reached the next
level of support at 9350/9300.
The intermediate trend is weak. Low volume in the past month and the fall below 9381 are both bear signals.
The primary trend is up.
The intermediate trend is weak. Low volume in the past month and the fall below 9381 are both bear signals.
The primary trend is up.
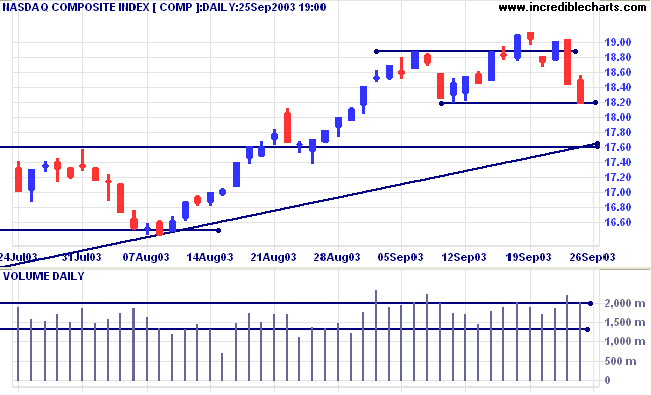
The Nasdaq Composite closed below support, at 1817 on strong
volume.
The intermediate trend is down and appears headed for a re-test of the long-term supporting trendline.
The primary trend is up.
The intermediate trend is down and appears headed for a re-test of the long-term supporting trendline.
The primary trend is up.
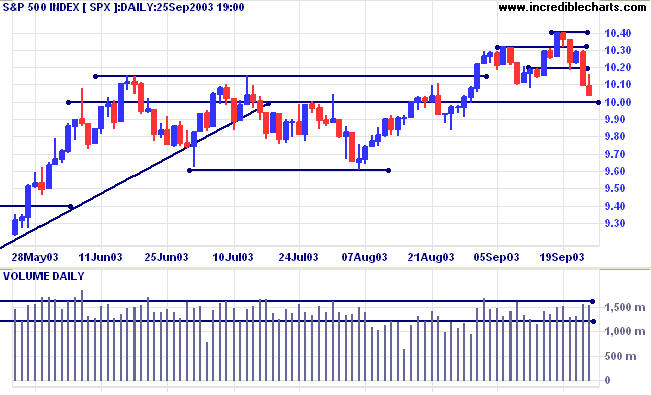
The S&P 500 penetrated the upper edge of the support band at
1008, on average volume.
The intermediate trend is weak. A fall below 1000 will signal reversal.
The primary trend is up.
The intermediate trend is weak. A fall below 1000 will signal reversal.
The primary trend is up.
The Chartcraft NYSE Bullish % Indicator declined
further to 80.3% (September 25).
Market Strategy
Short-term: Long if the S&P500 is above 1020. Short if below 1000.
Intermediate: Long if S&P 500 is above 1020.
Long-term: Long if the index is above 1008.
Short-term: Long if the S&P500 is above 1020. Short if below 1000.
Intermediate: Long if S&P 500 is above 1020.
Long-term: Long if the index is above 1008.
Lower jobless claims no cheer
Jobless claims were sharply lower last week but the cause was power outages at a number of Labor Department offices, caused by Hurricane Isabel. (more)
Jobless claims were sharply lower last week but the cause was power outages at a number of Labor Department offices, caused by Hurricane Isabel. (more)
Treasury yields
The intermediate down-trend continues, with the yield on 10-year treasury notes at 4.10%, testing support at 4.10% to 4.00%.
The primary trend is up.
The intermediate down-trend continues, with the yield on 10-year treasury notes at 4.10%, testing support at 4.10% to 4.00%.
The primary trend is up.
Gold
New York (17:55). Spot Gold tested 393 before retreating to $385.20.
The primary trend is up.
The target for the symmetrical triangle is calculated as 426 (365 + 382 - 321), but expect heavy resistance between 400 and 415 (the 10-year high).
New York (17:55). Spot Gold tested 393 before retreating to $385.20.
The primary trend is up.
The target for the symmetrical triangle is calculated as 426 (365 + 382 - 321), but expect heavy resistance between 400 and 415 (the 10-year high).
ASX Australia
The All Ordinaries again tested support, closing down 34 points
at 3180 on strong volume.
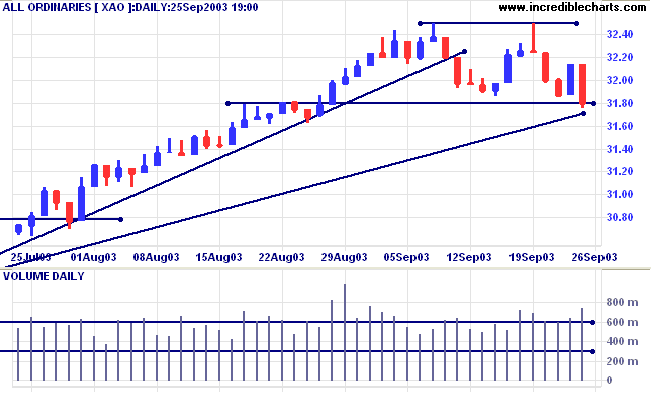
The intermediate up-trend has broken its trendline. A break below
3180 will signal reversal.
The primary trend is up.
MACD (26,12,9) is below its signal line; Slow Stochastic (20,3,3) is below;
Twiggs Money Flow has turned up, below zero, after a bearish divergence.
The primary trend is up.
MACD (26,12,9) is below its signal line; Slow Stochastic (20,3,3) is below;
Twiggs Money Flow has turned up, below zero, after a bearish divergence.
Market Strategy
Short-term: Long above 3214. Short if below 3180.
Intermediate: Long if the index is above 3214.
Long-term: Long if the index is above 3180.
Short-term: Long above 3214. Short if below 3180.
Intermediate: Long if the index is above 3214.
Long-term: Long if the index is above 3180.
Computershare [CPU]
Last covered August 21, 2003.
CPU broke out of its base after rallying off a marginal break at [b], below the previous low at [a]. MACD showed a strong bullish divergence at [a] followed by bullish troughs above the zero line [+].
Last covered August 21, 2003.
CPU broke out of its base after rallying off a marginal break at [b], below the previous low at [a]. MACD showed a strong bullish divergence at [a] followed by bullish troughs above the zero line [+].
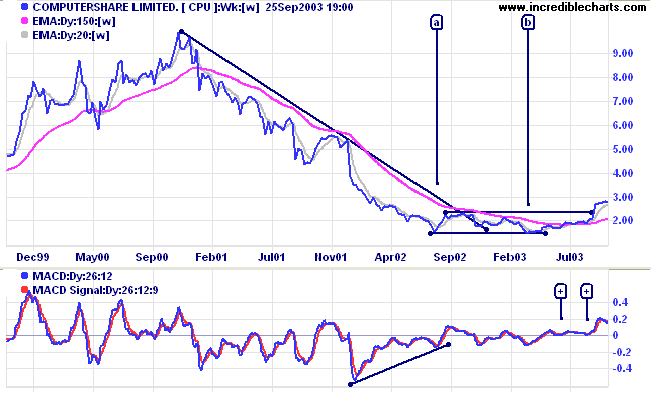
The breakout was confirmed by Relative Strength (price ratio:
xao) making a new 3-month high on August 14.
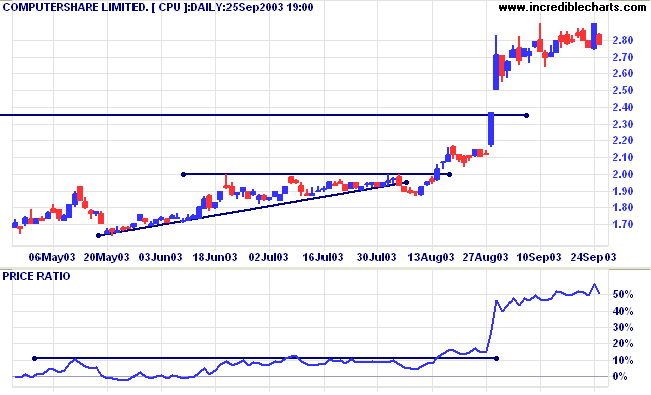
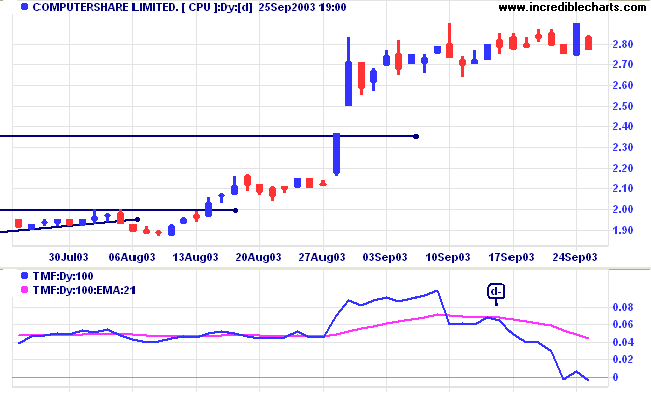
Price gapped up, to reach a high of 2.90, before consolidating in
a sideways, ranging pattern. Rectangle (ranging) patterns normal
resolve with a continuation of the preceding trend but a strong
bearish divergence on Twiggs Money Flow (100) warns of a
potential reversal.
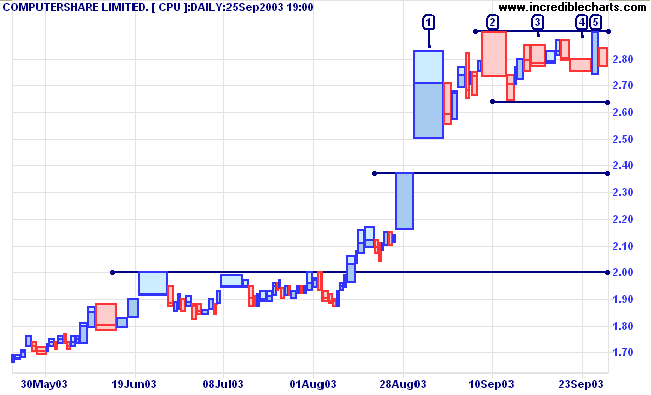
The equivolume chart shows how the large gap up at [1], on heavy
volume (the width of the bar), exhausted momentum. Low closes and
strong volume at [2], [3] and [4] signal weakness. [5] is more
encouraging but is immediately followed by an inside day.
There are 4 levels of support: the range low of 2.64; the bottom
end of the gap at 2.37; the high of the earlier consolidation at
2.00; and base support at 1.40. A break below 2.64 will have a
target of 2.00. A more conservative target would be 2.37.
A close above 2.90 will signal continuation of the up-trend, with a target of 3.80 (2.90 + 2.90 - 2.00).
A close above 2.90 will signal continuation of the up-trend, with a target of 3.80 (2.90 + 2.90 - 2.00).
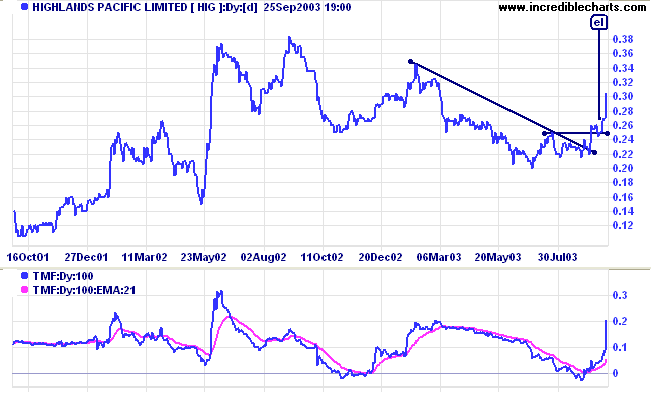
Highlands Pacific [HIG]
I missed this one but it is such a good example of an entry on a reversal that it is worth featuring. Lately I have been taking more of an interest in the ASX 300 because of the high number of strong performers compared to the ASX 200.
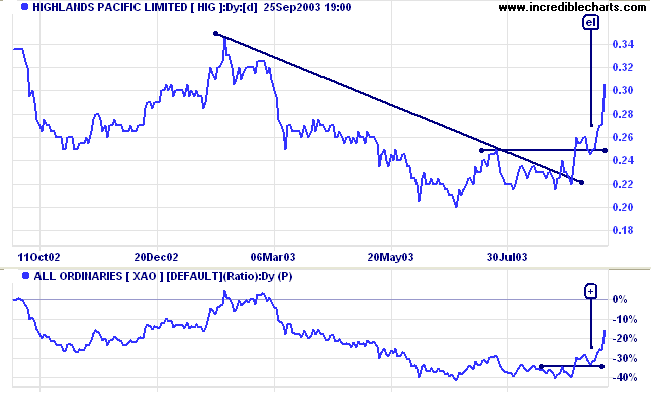
HIG is in the Materials sector: Diversified Metals & Mining. It broke the downward trendline after two higher lows, a bullish sign.
Twiggs Money Flow (100) turned up strongly above its signal line.
I missed this one but it is such a good example of an entry on a reversal that it is worth featuring. Lately I have been taking more of an interest in the ASX 300 because of the high number of strong performers compared to the ASX 200.
HIG is in the Materials sector: Diversified Metals & Mining. It broke the downward trendline after two higher lows, a bullish sign.
Twiggs Money Flow (100) turned up strongly above its signal line.
Relative Strength (price ratio: xao) gave a strong bull signal
[+], with a trough above the previous peak.
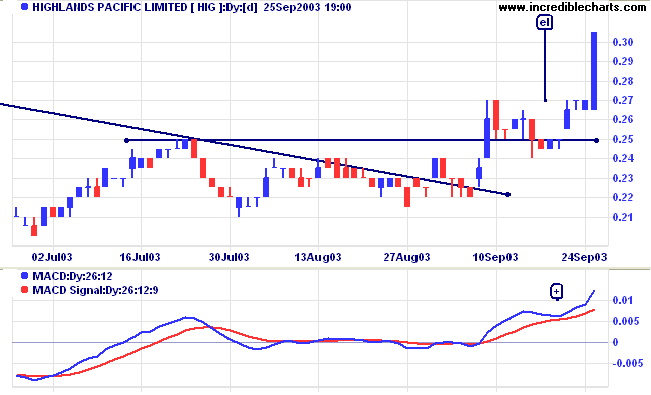
MACD failed to cross below its signal line on the pull-back, at
[+].
On the daily volume chart we can see the first bullish sign:
equal lows at [1] and [2]. This is followed by a breakout on
strong volume at [3]. The pull-back to [4] respected support at
0.25. With volume and volatility drying up, this presented an
entry opportunity. It is important to place the stop loss below
the lower border of the support band at 0.24. If not, the second
downward thrust would have stopped us out. And when you are
stopped out it is very difficult to jump straight back in on
another bull signal: once bitten, twice shy.
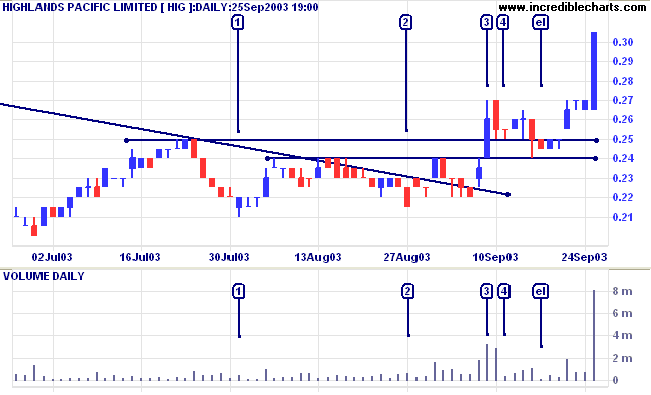
A second entry point presented itself at [el]: volume and
volatility dried up at the support level. Entry would be taken
with a buy-stop above the high of 0.25 and a stop-loss below
0.24.
Maximum loss is 8% (1 - 0.235/0.255) plus brokerage and
slippage. The target is resistance at 0.32, giving a
healthy risk/reward ratio of 3:1 (25.5% / 8%).
We may rue the lost opportunity, but there is still hope for an intermediate pull-back in the next few months, to re-test support levels.
We may rue the lost opportunity, but there is still hope for an intermediate pull-back in the next few months, to re-test support levels.
Colin Twiggs
Habits are like a cable.
We weave a strand of it every day
and soon it cannot be broken.
~ Horace Mann.
We weave a strand of it every day
and soon it cannot be broken.
~ Horace Mann.
|
Stock Screening: Price
Filter To screen for stocks in a specific price range, for example, stocks between 5 cents and 1 dollar: (1) select Price Filter; (2) enter 5 as the Minimum and 100 as the Maximum; and (3) Submit. |
Back Issues
You can now view back issues at the Daily Trading Diary Archives.
You can now view back issues at the Daily Trading Diary Archives.
Back Issues
Access the Trading Diary Archives.

Author: Colin Twiggs is a former investment banker with almost 40 years of experience in financial markets. He co-founded Incredible Charts and writes the popular Trading Diary and Patient Investor newsletters.
Using a top-down approach, Colin identifies key macro trends in the global economy before evaluating selected opportunities using a combination of fundamental and technical analysis.
Focusing on interest rates and financial market liquidity as primary drivers of the economic cycle, he warned of the 2008/2009 and 2020 bear markets well ahead of actual events.
He founded PVT Capital (AFSL No. 546090) in May 2023, which offers investment strategy and advice to wholesale clients.