| Incredible Charts version 4.0.2.300 |
|
The new version is now available. Check
Help >> About to ensure that you have the new
version. Live Update should load this automatically. Changes include a new Watchlist and new Printer module. See What's New for further details. The hint at the bottom of this newsletter explains how to work with the new watchlist menu. |
Trading Diary
August 21, 2003
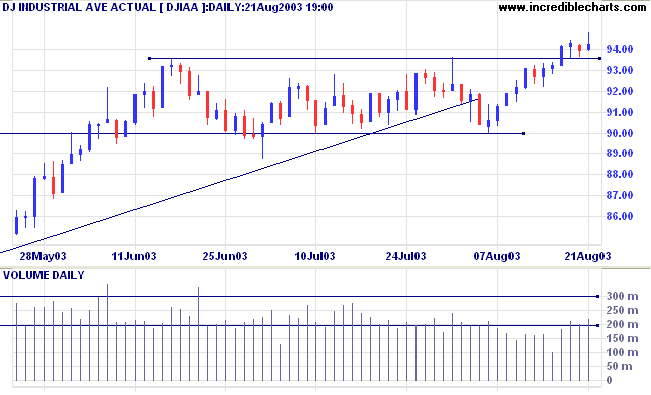
The intermediate trend is up.
The primary trend is up.
The intermediate trend has turned up.
The primary trend is up.
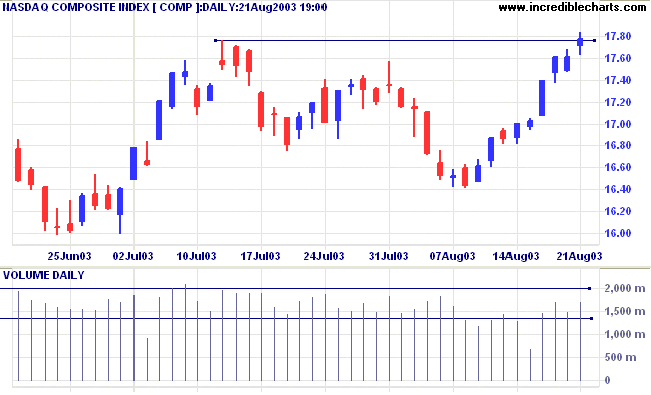
The intermediate trend will reverse up if the index rises above 1015.
The primary trend is up.
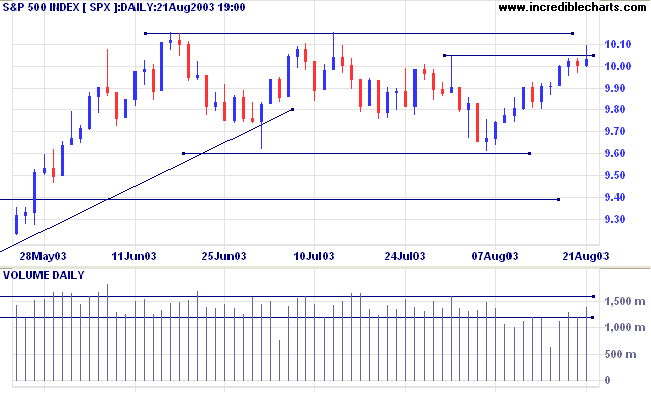
Short-term: Long if the S&P500 is above 1005. Short if below 980.
Intermediate: Long if S&P 500 is above 1015. Short if below 960.
Long-term: Long if the index is above 950.
New unemployment claims dropped last week to 386,000. (more)
The Philadelphia Federal Reserve, whose manufacturing report for the Mid-Atlantic region is normally one of the first to reach the market, says that its index of factory business conditions jumped to 22.1 in August, a five-year high. (more)
The yield on 10-year treasury notes rose to 4.51%.
The intermediate and primary trends are both up.
New York (17.56): Spot gold eased to $362.20.
The primary trend is up.
The intermediate trend is up. A fall below 2978 would signal a reversal.
The primary trend is up.
Slow Stochastic (20,3,3) has whipsawed to below its signal line; MACD (26,12,9) is above; Twiggs Money Flow has turned up, continuing to signal accumulation.
Both MACD and Twiggs Money Flow (21) show bearish divergences.
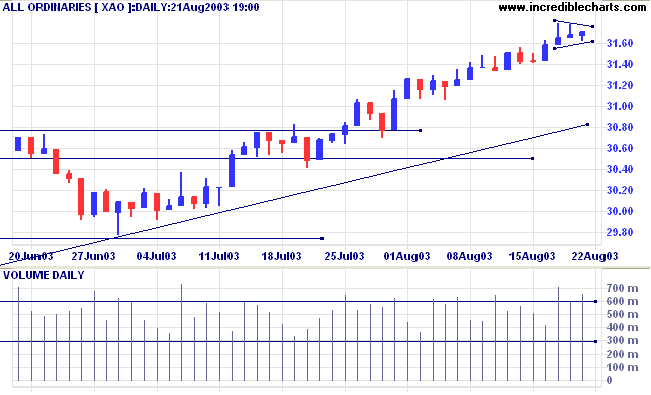
Short-term: Long if the All Ords is above 3171. Short if the intermediate trend reverses.
Intermediate: Long if the index is above 3171.
Long-term: Long if the index is above 2978 .
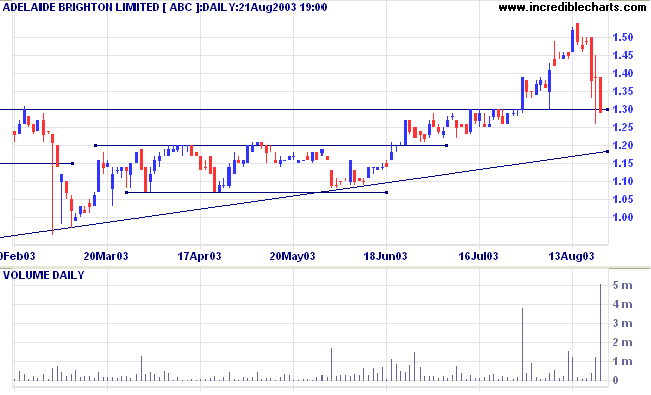
Covered yesterday, August 20, 2003.
ABC closed marginally below the 1.30 support level, at 1.29, on strong volume. The correction is likely to test the supporting trendline at 1.20. This is unlikely to be a false break, immediately retreating back above support, because of the strong close and big volume.
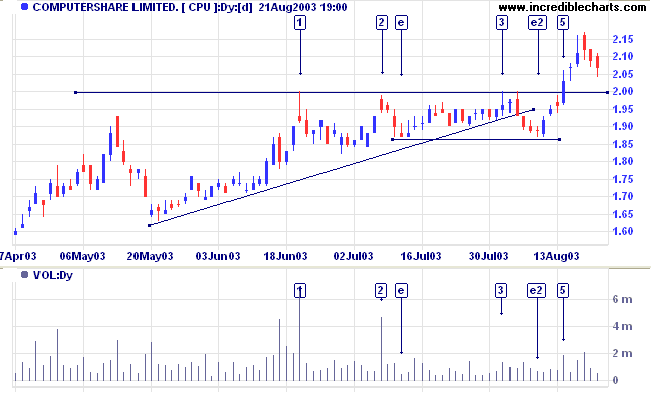
Covered yesterday, August 20, 2003.
Volume is drying up on the pull-back to the 2.00 support level, a bullish sign. The best way to increase a long position is to place a buy-stop above the latest high; so that you enter on a reversal.
Last covered July 17, 2003.
CFG formed a bullish ascending triangle after breaking out of a stage 1 base. Price then broke down, in a bearish move, through the supporting trendline. It has since rallied and now threatens to break back above the trendline.
Twiggs Money Flow (100) signaled a bearish divergence from [d] to [f] but has since turned back up, signaling accumulation.
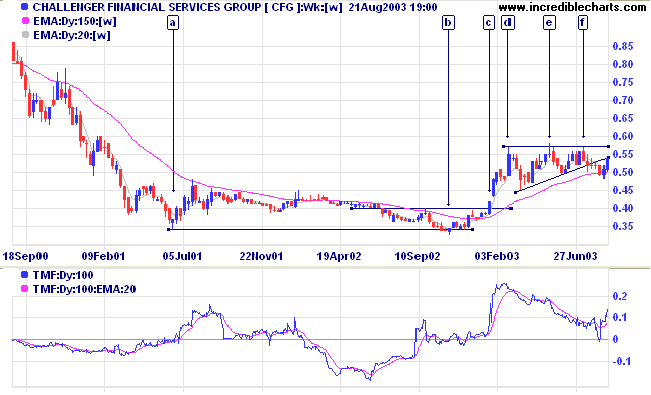
Relative Strength also dipped below the 3-month baseline but has since rallied.
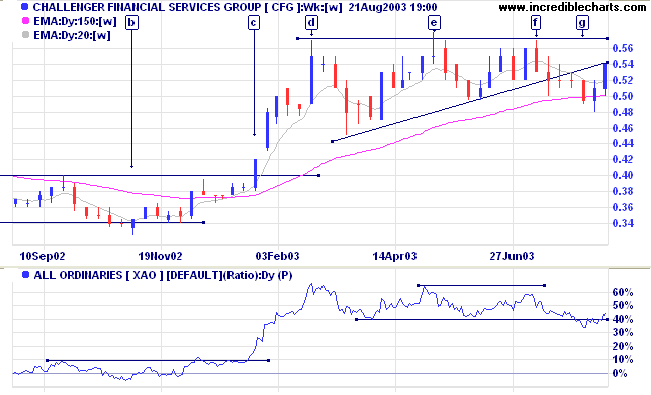
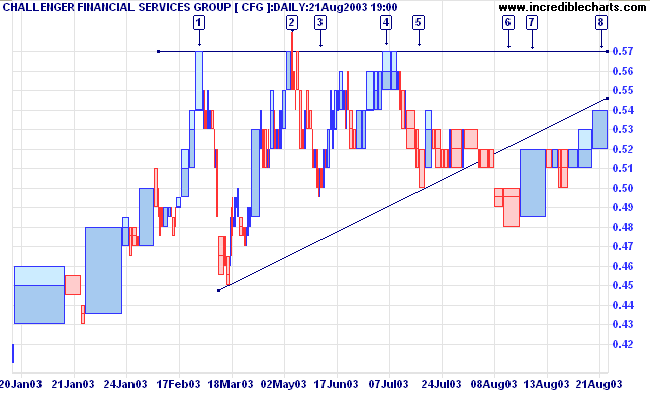
The target for the triangle breakout is 0.69: 0.57 + 0.57 - 0.45.
A fall below 0.50 would be bearish, with a close below 0.48 a stronger signal.
The trick in life is not to worry about making
a wrong decision;
it's learning when to correct!
~ Susan Jeffers: Feel The Fear And Do It Anyway.
| Scrolling through Watchlists |
|
This sequence has changed. To scroll
through a watchlist: (1) Place your mouse over Watchlist >> Select Active Watchlist and select your chosen watchlist from the available list. (2) Use the up/down arrows on the toolbar to scroll through the list. The name of active watchlist is displayed at the bottom of the Watchlist menu. Place your mouse over the watchlist name to select a security from the list. |
You can now view back issues at the Daily Trading Diary Archives.
Back Issues

Author: Colin Twiggs is a former investment banker with almost 40 years of experience in financial markets. He co-founded Incredible Charts and writes the popular Trading Diary and Patient Investor newsletters.
Using a top-down approach, Colin identifies key macro trends in the global economy before evaluating selected opportunities using a combination of fundamental and technical analysis.
Focusing on interest rates and financial market liquidity as primary drivers of the economic cycle, he warned of the 2008/2009 and 2020 bear markets well ahead of actual events.
He founded PVT Capital (AFSL No. 546090) in May 2023, which offers investment strategy and advice to wholesale clients.