| Incredible Charts version 4.0.2.300 |
| The new version should be released this weekend. Changes include a revised watchlist and securities menu, enabling the addition of ETOs, warrants and US stocks, and a new printer module, with greater printer compatibility and functionality. |
Trading Diary
August 20, 2003
The intermediate trend is up.
The primary trend is up.
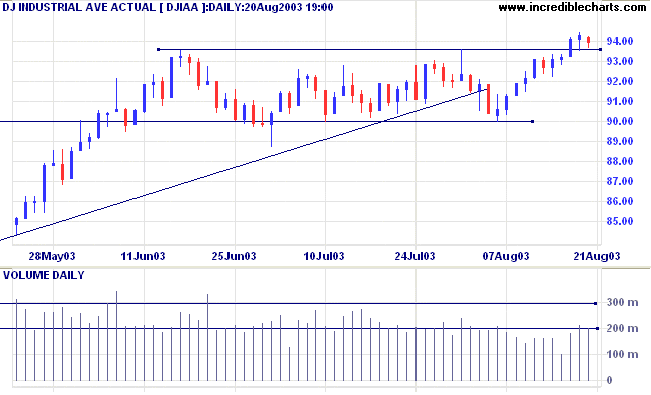
The intermediate trend will turn back up if the index rises above 1776.
The primary trend is up.
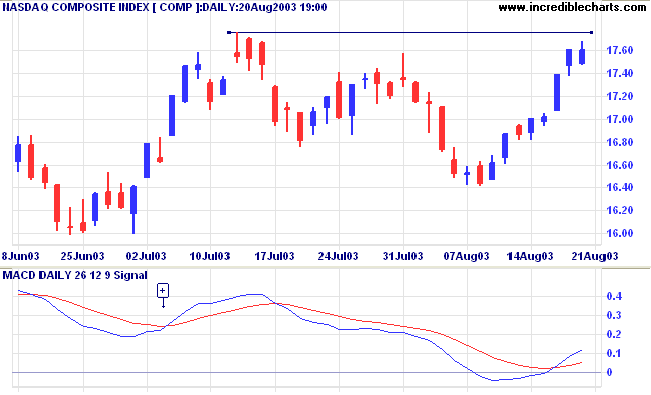
The intermediate trend will reverse up if the index rises above 1015.
The primary trend is up.
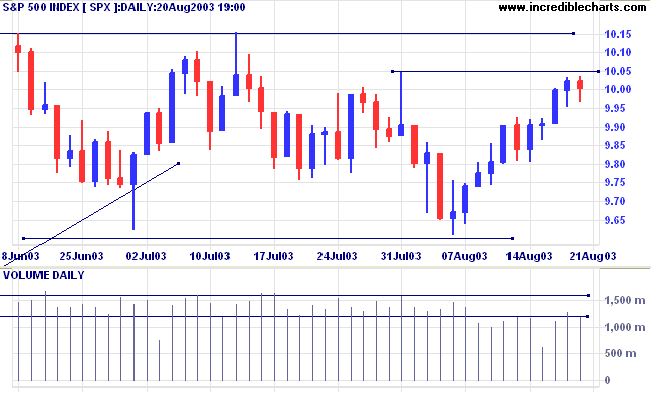
Short-term: Long if the S&P500 is above 1005. Short if below 980.
Intermediate: Long if S&P 500 is above 1015. Short if below 960.
Long-term: Long if the index is above 950.
Treasury yields rise, sending the dollar higher against the euro but failing to make gains against the yen. (more)
The yield on 10-year treasury notes rose to 4.44%.
The intermediate and primary trends are both up.
New York (17.56): Spot gold has rallied almost 5 dollars to $366.00.
The primary trend is up.
The intermediate trend is up. A fall below 2978 would signal a reversal.
The primary trend is up.
Slow Stochastic (20,3,3) has crossed to above its signal line; MACD (26,12,9) is above; Twiggs Money Flow continues to decline.
MACD and Twiggs Money Flow (21) both show bearish divergences.
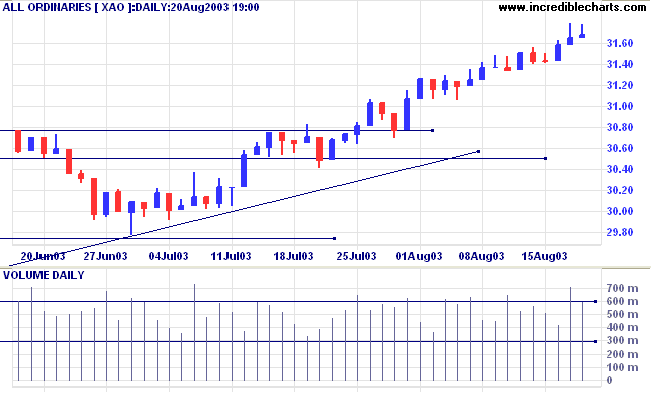
Short-term: Long if the All Ords is above 3178. Short if the intermediate trend reverses.
Intermediate: Long if the index is above 3178.
Long-term: Long if the index is above 2978 .
Correction: The target for the pennant was 1.35 and not 1.25: 1.19 + (1.24 - 1.08). The target has already been reached.
Last covered on July 30, 2003.
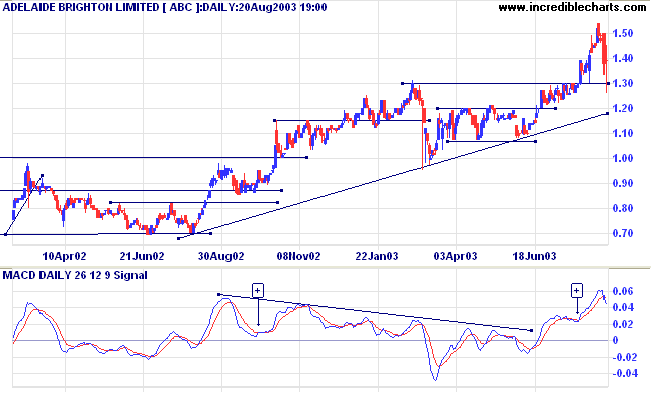
ABC is in a stage 2 up-trend, with Twiggs Money Flow (100) signaling accumulation.
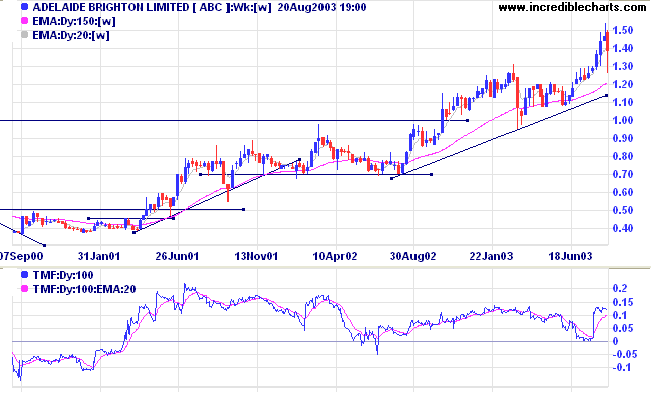
MACD and Relative Strength both record the down-turn but are still bullish.
The more recent breakout above 1.30 at [2] was accompanied by strong volume. After a brief test of support, price then rallied to above 1.50.
An early warning of the reversal is the distribution on the day before [3], where price did not move on strong volume.
After the high, price paused briefly for two days on low volume, before falling sharply at [4].
The following day shows buying support, with a weak close on strong volume.
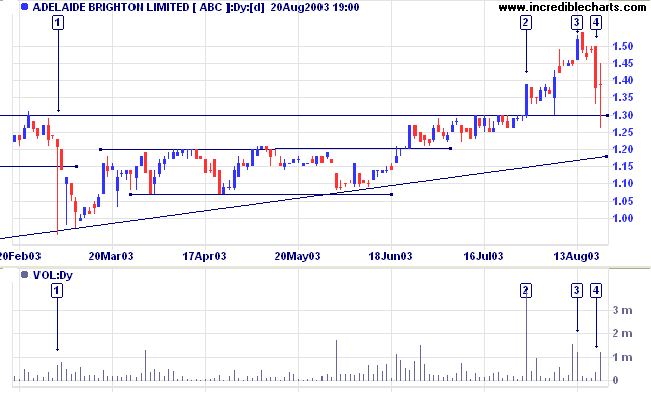
A close below the supporting trendline would be bearish.
Last covered on August 4, 2003.
CPU has formed a broad stage 1 base, with a double bottom at [a] and [h].
Twiggs Money Flow (100) signals accumulation despite a recent bearish divergence.
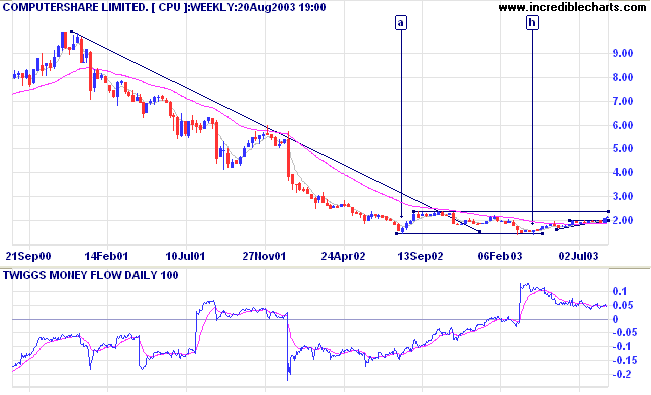
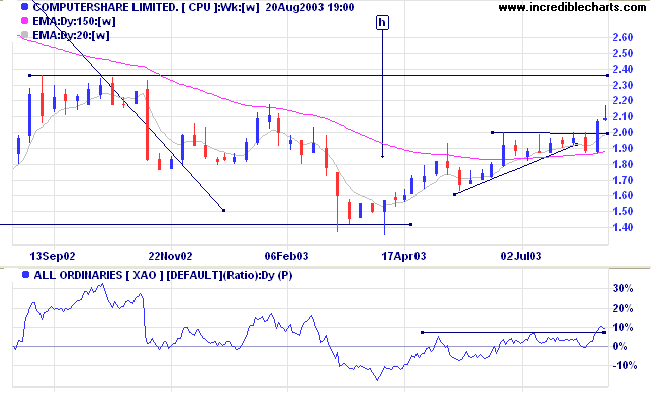
MACD has completed a second bullish trough [+] above zero.
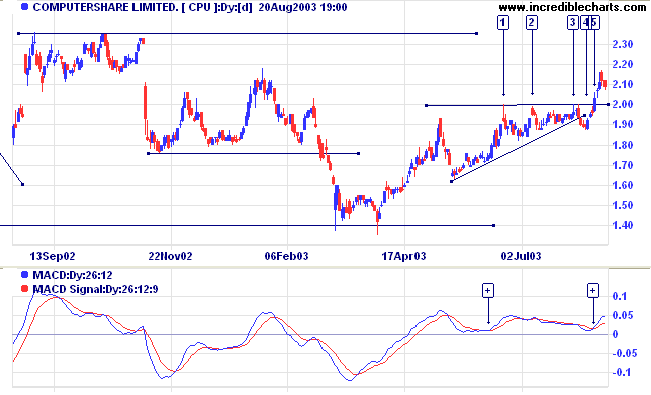
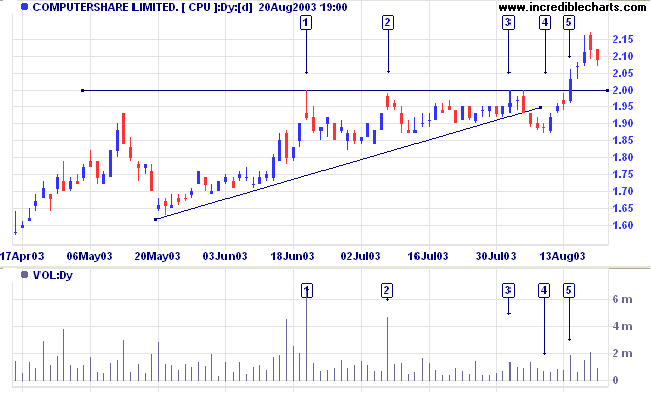
This may present entry opportunities if price holds above the support level.
A close below 2.00 would be bearish.
All you have to do to diminish your fear
is to develop more trust in your ability
to handle whatever comes your way!
~ Susan Jeffers: Feel The Fear And Do It Anyway.
| Scrolling - Time Period |
|
To change the speed at which you scroll
back/forward: Select View >> Scroll Period and adjust the setting to a higher number of days. |
You can now view back issues at the Daily Trading Diary Archives.
Back Issues

Author: Colin Twiggs is a former investment banker with almost 40 years of experience in financial markets. He co-founded Incredible Charts and writes the popular Trading Diary and Patient Investor newsletters.
Using a top-down approach, Colin identifies key macro trends in the global economy before evaluating selected opportunities using a combination of fundamental and technical analysis.
Focusing on interest rates and financial market liquidity as primary drivers of the economic cycle, he warned of the 2008/2009 and 2020 bear markets well ahead of actual events.
He founded PVT Capital (AFSL No. 546090) in May 2023, which offers investment strategy and advice to wholesale clients.