|
Incredible Charts version
4.0.2.500 The new version is now available. Check Help>>About to ensure that your software has been automatically updated. The update offers further improvements to the watchlist menu, powerful new scrolling features and supports the use of Large Font settings on laptop (and desktop) computers. See What's New? for further details. |
Trading Diary
September 10, 2003
These extracts from my daily trading diary
are for educational purposes
only and should not be
interpreted as investment advice. Full terms and conditions can
be found at Terms
of Use .
USA
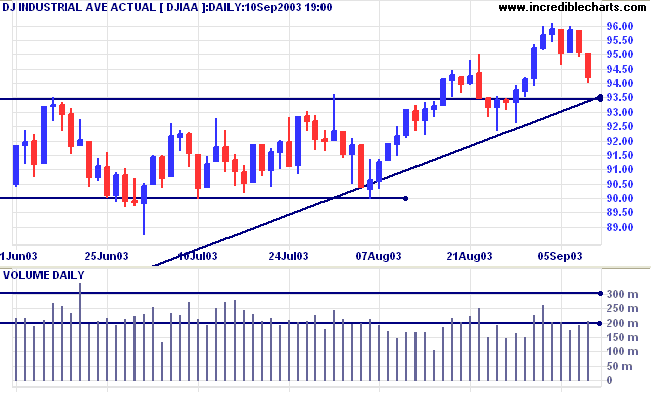
The Dow Industrial Average closed down 0.9% at 9420 on low
volume, headed for a test of support at 9350.
The intermediate trend is up.
The primary trend is up.
The intermediate trend is up.
The primary trend is up.
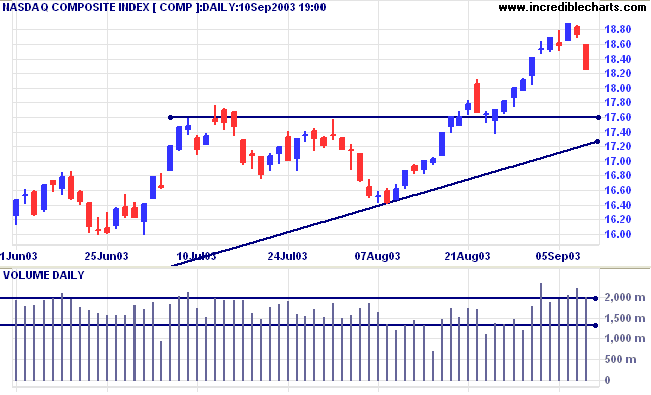
The Nasdaq Composite gapped down 49 points to close at 1824 on
strong volume. The index is likely to re-test support at
1760.
The intermediate trend is up.
The primary trend is up.
The intermediate trend is up.
The primary trend is up.
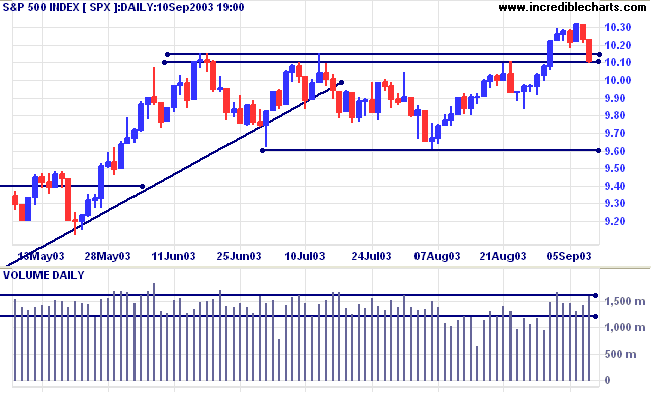
The S&P 500 fell 12 points to close at 1011 on strong volume.
The index broke through the upper edge of the support band but
closed just above the lower border, at 1011. A close below 1010
may signal a re-test of support at 960.
The intermediate trend is up.
The primary trend is up.
The intermediate trend is up.
The primary trend is up.
The Chartcraft NYSE Bullish % Indicator retreated
0.45% to 79.66% (September 10).
Market Strategy
Short-term: Long if the S&P500 is above 1023.
Intermediate: Long if S&P 500 is above 1023.
Long-term: Long is the index is above 960.
Short-term: Long if the S&P500 is above 1023.
Intermediate: Long if S&P 500 is above 1023.
Long-term: Long is the index is above 960.
Bears maul tech stocks
An earnings revision by Texas Instruments, and downgrades of Nortel and Juniper, spark a sell-off. (more)
An earnings revision by Texas Instruments, and downgrades of Nortel and Juniper, spark a sell-off. (more)
Treasury yields
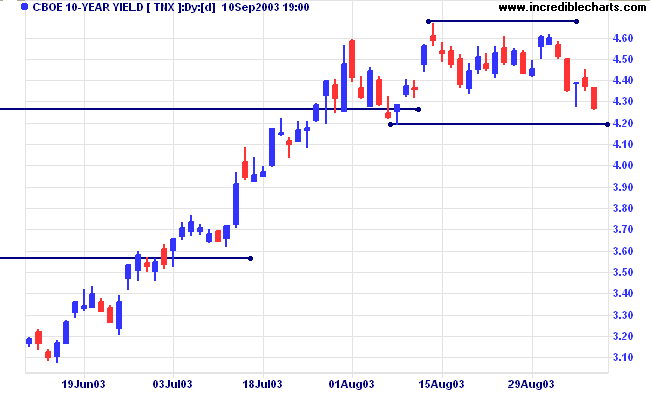
The yield on 10-year treasury notes closed lower at 4.27%, headed for a re-test of support at 4.20%.
The primary trend is up.
The yield on 10-year treasury notes closed lower at 4.27%, headed for a re-test of support at 4.20%.
The primary trend is up.
Gold
New York (20.57): Spot gold again tested overhead resistance at 382, before retreating to $379.60.
The primary trend is up.
Price has broken above a symmetrical triangle formed since the start of the year. If gold penetrates overhead resistance at 382, the target is the 10-year high of 420.
New York (20.57): Spot gold again tested overhead resistance at 382, before retreating to $379.60.
The primary trend is up.
Price has broken above a symmetrical triangle formed since the start of the year. If gold penetrates overhead resistance at 382, the target is the 10-year high of 420.
ASX Australia
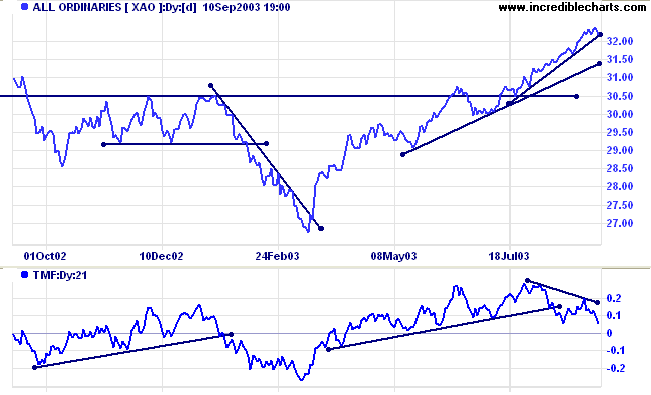
The All Ordinaries closed down 18 points at 3220 on strong
volume, signaling the likelihood of a correction back to the
long-term trendline.
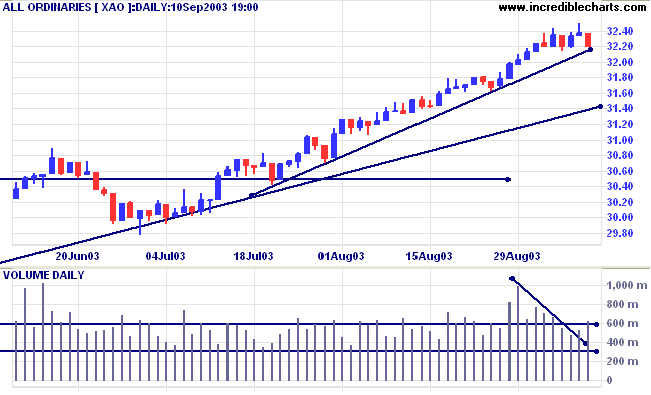
The intermediate and primary trends are up.
MACD (26,12,9) has crossed to below its signal line, forming a bearish divergence; Slow Stochastic (20,3,3) has whipsawed below its signal line; and Twiggs Money Flow shows a bearish divergence.
MACD (26,12,9) has crossed to below its signal line, forming a bearish divergence; Slow Stochastic (20,3,3) has whipsawed below its signal line; and Twiggs Money Flow shows a bearish divergence.
Market Strategy
Short-term: Long above 3238.
Intermediate: Long if the index is above 3160.
Long-term: Long if the index is above 2978.
Short-term: Long above 3238.
Intermediate: Long if the index is above 3160.
Long-term: Long if the index is above 2978.
Challenger [CFG]
Last covered on August 21, 2003.
Challenger formed a broad consolidation in the form of an ascending triangle but failed to break through resistance at 0.57. Price then made a false downward break at [1] before rallying strongly to close above the resistance level for the first time. This proved to be another false break, with heavy selling forcing price back below 0.57.
Relative Strength is level while MACD has made a bullish break of its downward trendline.
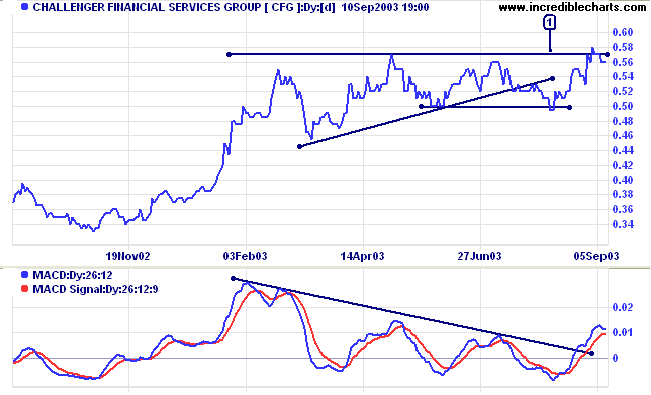
Twiggs Money Flow (100) dipped below zero at [1] but has since
recovered to signal accumulation.
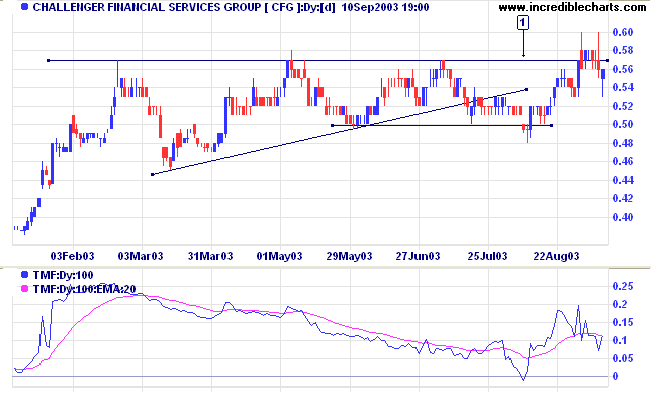
Equivolume clearly illustrates the false break below 0.50, with
fair volume but weak closes, followed by a rally on strong volume
at [1]. We again see heavy volume on a rally at [2], but this is
met with equally committed selling at [3] and again at [4].
Eventually buyers are overcome and price retreats but not by
much; the weak close and strong volume at [5] signal renewed
buying pressure and we are likely to see another attempt at the
resistance level fairly soon.
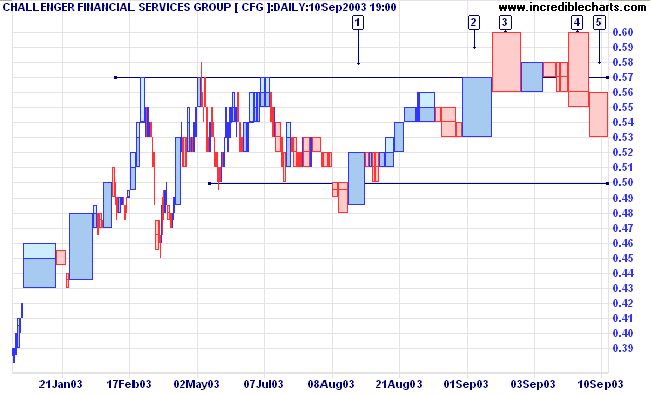
A dry up of volume and/or volatility on the correction may
present an opportunity for short-term traders. Longer-term
traders may be waiting for a pull-back, following a breakout,
that respects 0.57.
A close below 0.50 would be bearish, while a close below 0.48 would be a stronger signal.
A close below 0.50 would be bearish, while a close below 0.48 would be a stronger signal.
Understanding
the Trading Diary has been expanded to offer further
assistance to readers.
Colin Twiggs
Remember that the stock market is
manic-depressive.
~ Warren Buffet.
~ Warren Buffet.
Set Menu Length
|
Incredible Charts optimizes securities
menu and watchlist display settings to fit your screen
resolution and screen size, avoiding the need for scrolling
menus. To set the optimum menu length: select View >> Set Menu Length >> Autofit to
Screen. This does mean that lengthy menus will display sub-folders. You may wish to experiment with manual settings such as: View >> Set Menu Length >> 100. See Customize Menus for further details. |
Back Issues
You can now view back issues at the Daily Trading Diary Archives.
You can now view back issues at the Daily Trading Diary Archives.
Back Issues
Access the Trading Diary Archives.

Author: Colin Twiggs is a former investment banker with almost 40 years of experience in financial markets. He co-founded Incredible Charts and writes the popular Trading Diary and Patient Investor newsletters.
Using a top-down approach, Colin identifies key macro trends in the global economy before evaluating selected opportunities using a combination of fundamental and technical analysis.
Focusing on interest rates and financial market liquidity as primary drivers of the economic cycle, he warned of the 2008/2009 and 2020 bear markets well ahead of actual events.
He founded PVT Capital (AFSL No. 546090) in May 2023, which offers investment strategy and advice to wholesale clients.