| Incredible Charts version 4.0.2.300 |
| Testing is taking longer than expected and the new version should be released in a few days. Changes include a revised watchlist and securities menu, enabling the addition of ETOs, warrants and US stocks, and a new printer module, with greater printer compatibility and functionality. |
Trading Diary
August 19, 2003
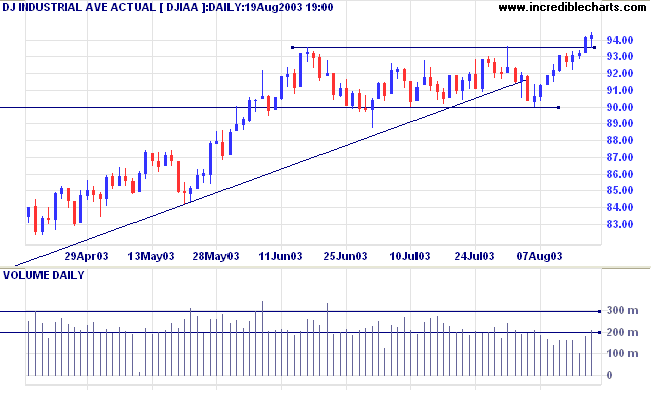
The Dow has held above support at 9350 on higher volume, closing 0.2% up at 9429.
The intermediate trend is up.
The primary trend is up.
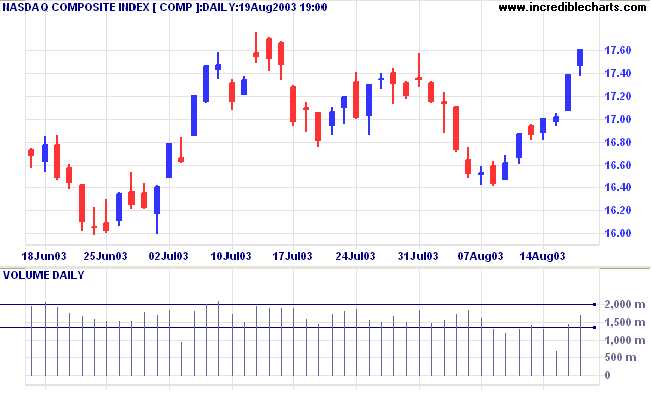
The intermediate trend will turn back up if the index rises above 1776.
The primary trend is up.
The intermediate trend will reverse up if the index rises above 1015.
The primary trend is up.
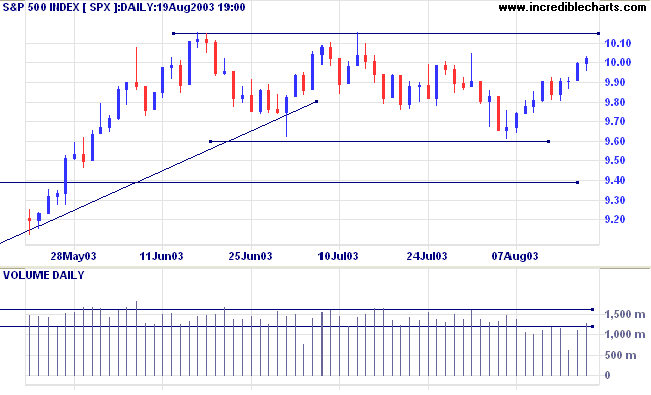
Short-term: Long if the S&P500 is above 1000. Short if below 980.
Intermediate: Long if S&P 500 is above 1015. Short if below 960.
Long-term: Long if the index is above 950.
HP returns to profit, posting earnings of 10 cents per share, but fails to meet analysts expectations. (more)
The University of Michigan index of consumer sentiment recorded a fall to 90.2 from 90.9 in July. (more)
The yield on 10-year treasury notes retreated back to 4.36%.
The intermediate and primary trends are both up.
New York (18.15): Spot gold rallied 350 cents to $361.70.
The primary trend is up.
The intermediate trend is up. A fall below 2978 would signal a reversal.
The primary trend is up.
Slow Stochastic (20,3,3) is below its signal line; MACD (26,12,9) is above; Twiggs Money Flow signals accumulation.
MACD and Twiggs Money Flow (21) continue to show bearish divergences.
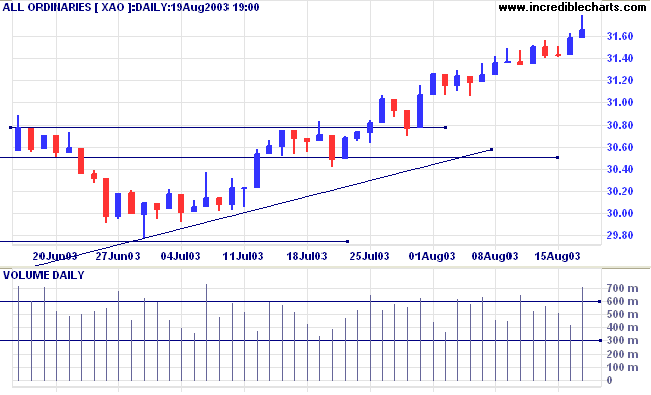
Short-term: Long if the All Ords is above 3165. Short if the intermediate trend reverses.
Intermediate: Long if the index is above 3165.
Long-term: Long if the index is above 2978 .
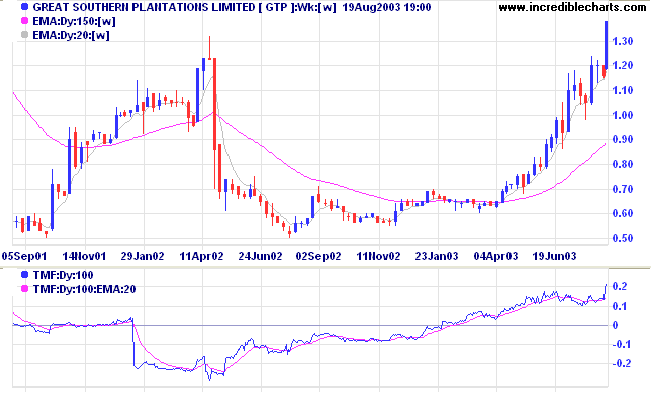
The weekly chart of GTP shows past volatility, with fast rallies and some sharp corrections. Price has recently made a new 2-year high but will the rally be able to sustain itself?
Twiggs Money Flow (100) signals strong accumulation, while Relative Strength and MACD are rising fast.
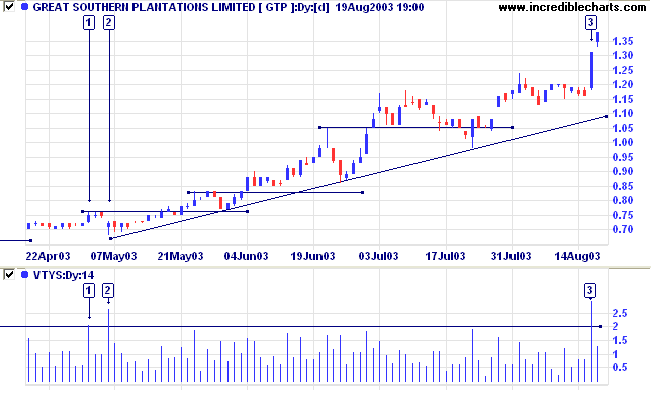
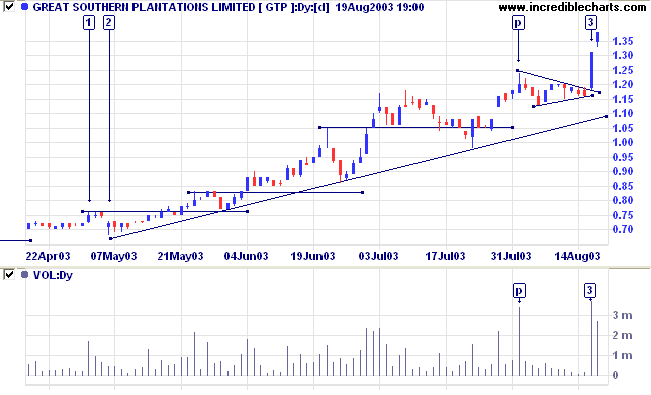
Re-enter (on buy signals) when price returns to the supporting trendline.
A close below the supporting trendline would be a bear signal.
Last covered on August 18, 2003.
SGW fell after reporting a 40% drop in earnings, but recovered to close above the 2.90 support level on strong volume. (more)
The false break below support may have triggered many traders stops.
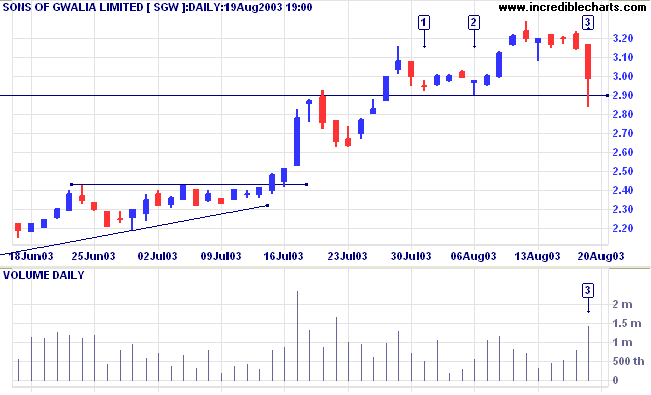
A close below the support level would be bearish.
The trend is your friend except at the end
when it bends.
~ Ed Seykota.
| Advertising Banners |
|
To hide advertising banners: Select View >> Hide Top Advert; and View >> Hide Right Buttons. |
You can now view back issues at the Daily Trading Diary Archives.
Back Issues

Author: Colin Twiggs is a former investment banker with almost 40 years of experience in financial markets. He co-founded Incredible Charts and writes the popular Trading Diary and Patient Investor newsletters.
Using a top-down approach, Colin identifies key macro trends in the global economy before evaluating selected opportunities using a combination of fundamental and technical analysis.
Focusing on interest rates and financial market liquidity as primary drivers of the economic cycle, he warned of the 2008/2009 and 2020 bear markets well ahead of actual events.
He founded PVT Capital (AFSL No. 546090) in May 2023, which offers investment strategy and advice to wholesale clients.