| Searching the Trading Diary Archives |
Use the normal Search function at the top
of the website page:
EXAMPLE |
Trading Diary
July 28, 2003
The Dow traded in a narrow range below 9300, closing slightly lower at 9267 on average volume.
The intermediate trend is up. A decline below 9000 will signal a down-turn.
The primary trend is up.
The intermediate trend is up. A fall below 976 will signal a down-turn.
The primary trend is up.
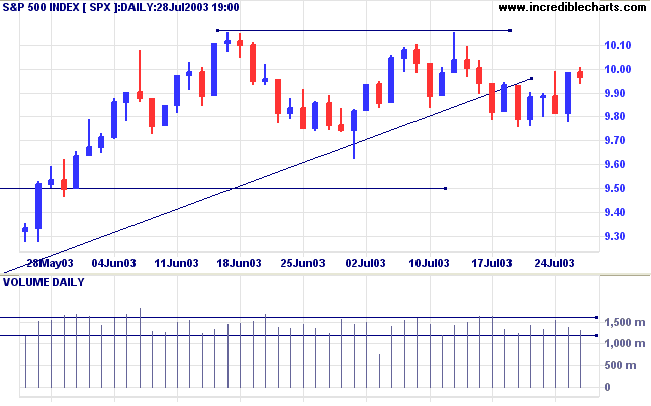
The intermediate trend is up.
The primary trend is up.
Intermediate: Long if the S&P is above 1015. Short if below 962.
Long-term: Long if above 962.
The Treasury Department expects to borrow $104bn in the current quarter to fund the growing budget deficit. (more)
CBOE: The yield on 10-year notes continues to rise, closing at 4.28%.
The intermediate trend is up; the primary trend is down.
New York (19.49): Spot gold continues to rise, reaching $US 364.20.
On the five-year chart gold is above the long-term upward trendline.
The intermediate trend is up.
The primary trend is up.
MACD (26,12,9) is above its signal line; Slow Stochastic (20,3,3) is above; Twiggs Money Flow (21) signals accumulation.
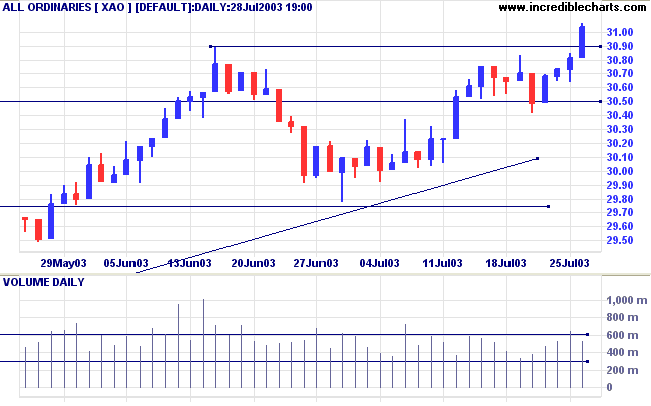
Intermediate: The primary trend is up; Long if the All Ords is above 3089.
Long-term: Long if the index is above 2978.
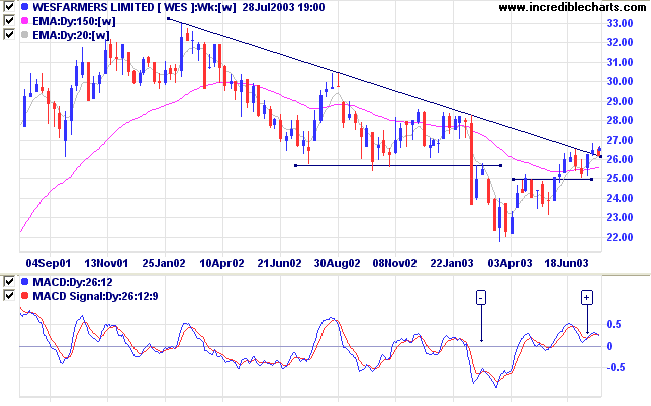
Last covered on August 6, 2002.
WES has recently broken above its long-term downward trendline after forming a narrow V-bottom. As I have mentioned before, narrow bottoms are unstable and often break down (especially near the long-term trendline) to re-test support at the bottom of the "V".
In this case MACD has completed a bullish trough [+] above zero, just below the trendline. Relative Strength (price ratio: xao) is rising, but slowly.
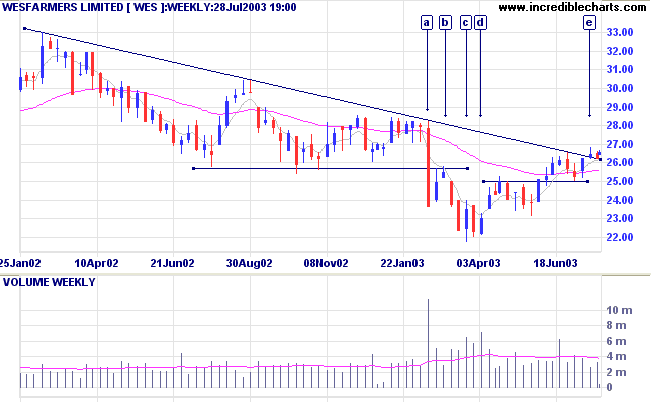
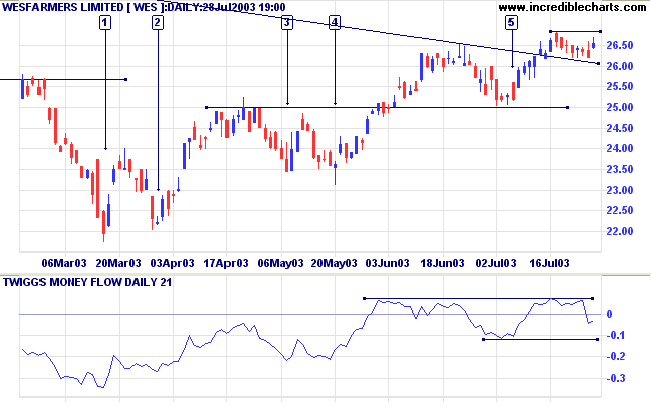
Note the earlier double bottom at [1] and [2], with strong volume on the higher low at [2]. A similar pattern occurs at [3] and [4], but this time the second low displays a false break at [4]. Both [2] and [4] are bullish signals.
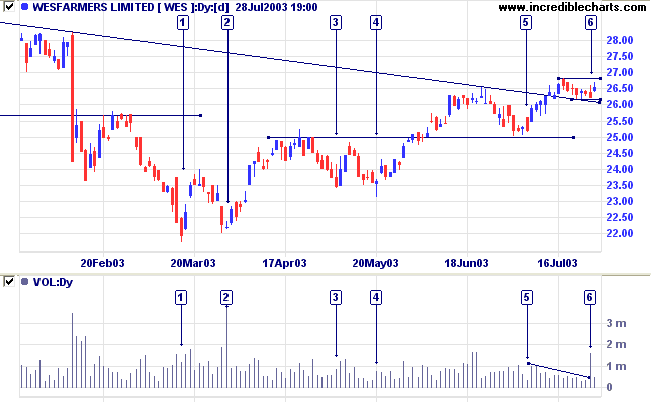
Short-term traders should always be on the lookout for a change in the intermediate trend. A fall below 26.18 (beneath [6]) may present a short opportunity, while a break below support at 25.00 would be a strong bear signal.
"Run quick" or not at all;
that is to say, act promptly at the first approach of danger,
but failing to do this until others see the danger,
hold on or close out part of the "interest".
~ S.A. Nelson: The ABC of Stock Speculation (1902).
| Stock Screens: Trending Stocks |
|
Directional movement is another useful
screen for identifying trending stocks. To identify
up-trending stocks: |
You can now view back issues at the Daily Trading Diary Archives.
Back Issues

Author: Colin Twiggs is a former investment banker with almost 40 years of experience in financial markets. He co-founded Incredible Charts and writes the popular Trading Diary and Patient Investor newsletters.
Using a top-down approach, Colin identifies key macro trends in the global economy before evaluating selected opportunities using a combination of fundamental and technical analysis.
Focusing on interest rates and financial market liquidity as primary drivers of the economic cycle, he warned of the 2008/2009 and 2020 bear markets well ahead of actual events.
He founded PVT Capital (AFSL No. 546090) in May 2023, which offers investment strategy and advice to wholesale clients.