Trading Diary
July 8, 2003
These extracts from my daily trading diary are
intended to illustrate the techniques used in short-term trading
and should not be interpreted as investment advice. Full terms
and conditions can be found at Terms
of Use .
USA
The Dow formed an inside day, signaling indecision. The index closed almost unchanged at 9223 on average volume.
The intermediate trend has turned up.
The primary trend is up.
The Dow formed an inside day, signaling indecision. The index closed almost unchanged at 9223 on average volume.
The intermediate trend has turned up.
The primary trend is up.
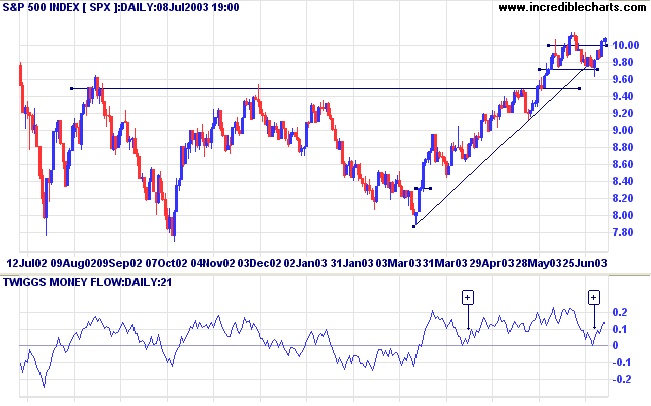
The S&P 500 closed 3 points higher at 1007.
The intermediate trend is up.
The primary trend is up.
The intermediate trend is up.
The primary trend is up.
The Nasdaq Composite continued to rally, rising 1.5% to close at
1746.
The intermediate trend is up.
The primary trend is up.
The intermediate trend is up.
The primary trend is up.
The Chartcraft NYSE Bullish % Indicator formed a
new high at 75.37% on July 7.
Market Strategy
Short-term: Long if the S&P 500 is above 995.
Intermediate: Long if the S&P is above 995.
Long-term: Long.
Intermediate: Long if the S&P is above 995.
Long-term: Long.
Microsoft: stock options
The software giant will cease to issue stock options and in future award shares to employees. (more)
The software giant will cease to issue stock options and in future award shares to employees. (more)
Gold
New York (17.57): Spot gold declined almost $4.00 to $US 344.40.
On the five-year chart gold is above the long-term upward trendline.
New York (17.57): Spot gold declined almost $4.00 to $US 344.40.
On the five-year chart gold is above the long-term upward trendline.
ASX Australia
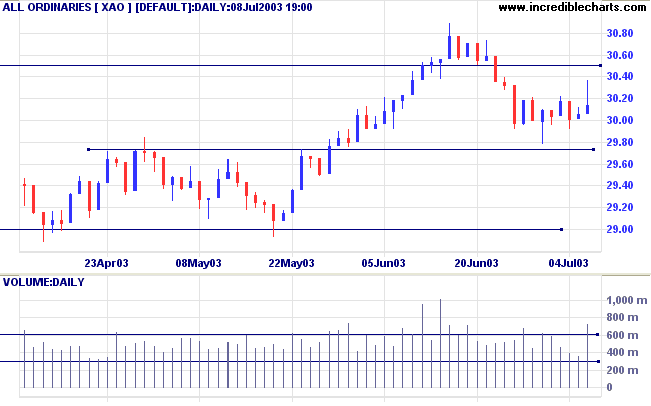
The All Ordinaries closed 9 points higher at 3014 on strong
volume. The index formed a gravestone
candle, but its significance is reduced because it does not
follow an up-trend.
The intermediate trend has turned up.
The primary trend is up.
MACD (26,12,9) and Slow Stochastic (20,3,3) are below their signal lines; Twiggs Money Flow (21) signals accumulation.
The intermediate trend has turned up.
The primary trend is up.
MACD (26,12,9) and Slow Stochastic (20,3,3) are below their signal lines; Twiggs Money Flow (21) signals accumulation.
Market Strategy
Short-term: Long if the All Ords is above 3022.
Intermediate: The primary trend is up; Long if the All Ords is above 3022.
Long-term: Long.
Intermediate: The primary trend is up; Long if the All Ords is above 3022.
Long-term: Long.
Westpac [WBC]
Last covered on June 26, 2003.
Westpac has retreated after testing resistance below 17.00.
Relative Strength (price ratio: xao) is weakening.
Twiggs Money Flow (100-day and 21-day) still signal accumulation.
Last covered on June 26, 2003.
Westpac has retreated after testing resistance below 17.00.
Relative Strength (price ratio: xao) is weakening.
Twiggs Money Flow (100-day and 21-day) still signal accumulation.
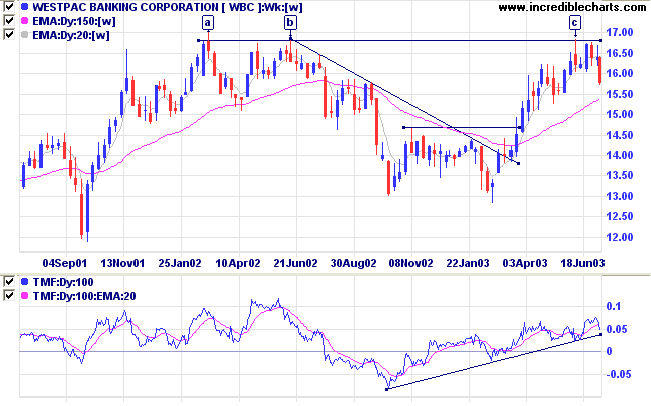
MACD has formed a bearish divergence.
Price has failed to break through the resistance level after 3 attempts, at [c], [5] and [7].
Price has failed to break through the resistance level after 3 attempts, at [c], [5] and [7].
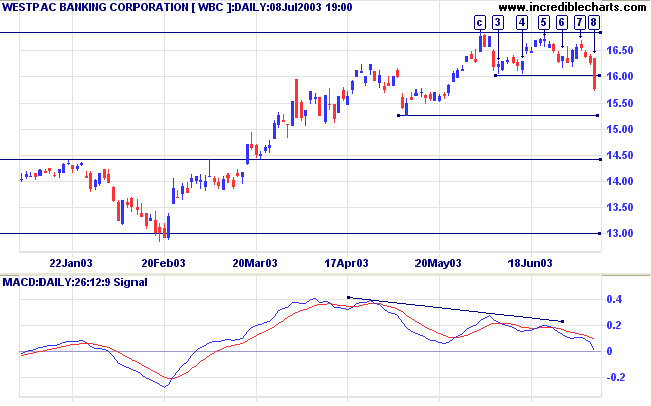
Volume dried up on the rallies at [5] and [7].
The downward break at [8] is accompanied by strong volume.
The downward break at [8] is accompanied by strong volume.
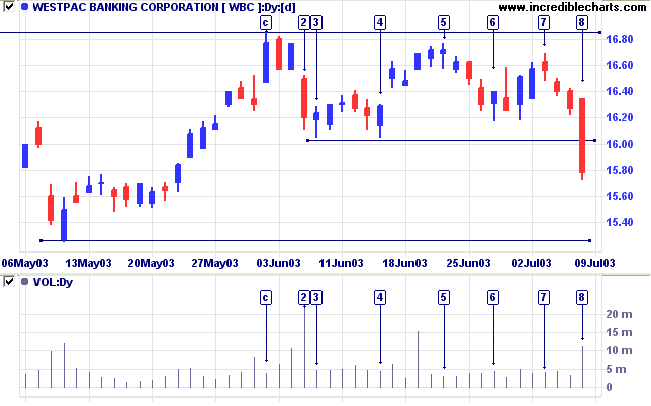
The intermediate trend has turned down but the primary trend is
still up.
The next support level is at 15.25. A close below this level may foreshadow a re-test of support at 13.00.
If WBC respects the support level, we will likely see further consolidation before another attempt at the 17.00 resistance level.
The next support level is at 15.25. A close below this level may foreshadow a re-test of support at 13.00.
If WBC respects the support level, we will likely see further consolidation before another attempt at the 17.00 resistance level.
Understanding
the Trading Diary has been expanded to offer further
assistance to readers.
Colin Twiggs
We don't see things as they are, but we see them as we are.
~ Anais Nin.
~ Anais Nin.
Stock Screens: MA Crossovers
To highlight stocks in established up/down trends:
(1) Select a fast and slow moving average;
(2) Select the Bull or Bear signal;
(3) Enter 9999 as the time period;
(4) Sort the Return by clicking on the MA heading.
This will order all trending stocks from the longest, most established trends,
down to the the most recent crossovers.
Back Issues
You can now view back issues at the Daily Trading Diary Archives.
You can now view back issues at the Daily Trading Diary Archives.
Back Issues
Access the Trading Diary Archives.

Author: Colin Twiggs is a former investment banker with almost 40 years of experience in financial markets. He co-founded Incredible Charts and writes the popular Trading Diary and Patient Investor newsletters.
Using a top-down approach, Colin identifies key macro trends in the global economy before evaluating selected opportunities using a combination of fundamental and technical analysis.
Focusing on interest rates and financial market liquidity as primary drivers of the economic cycle, he warned of the 2008/2009 and 2020 bear markets well ahead of actual events.
He founded PVT Capital (AFSL No. 546090) in May 2023, which offers investment strategy and advice to wholesale clients.