
To find out more about US indexes
follow the links on the Indexes
page.
Trading Diary
June 9, 2003
These extracts from my daily trading diary are
intended to illustrate the techniques used in short-term trading
and should not be interpreted as investment advice. Full terms
and conditions can be found at Terms
of Use .
USA
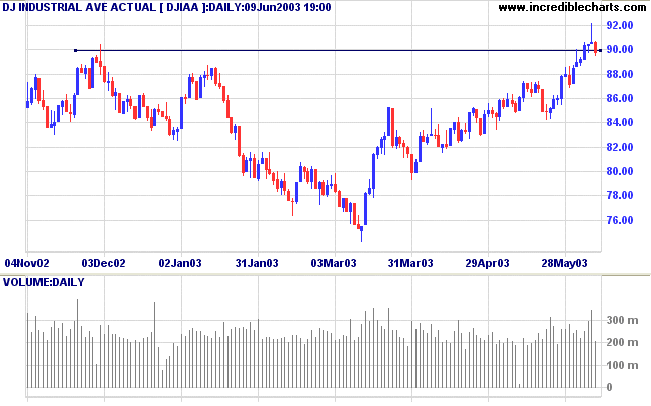
The Dow corrected back below the 9000 support level; closing down 0.9% at 8980 on lower volume. A false (marginal) break above resistance is a strong bear signal.
The intermediate trend is up.
The primary up-trend is up.
The Dow corrected back below the 9000 support level; closing down 0.9% at 8980 on lower volume. A false (marginal) break above resistance is a strong bear signal.
The intermediate trend is up.
The primary up-trend is up.
The S&P 500 retreated 15 points to close at 975.
The intermediate trend is up.
The primary trend is up.
The intermediate trend is up.
The primary trend is up.
The Nasdaq Composite gapped down 1.4% to close at 1603.
The intermediate trend is up.
The index is in a primary up-trend.
The intermediate trend is up.
The index is in a primary up-trend.
The Chartcraft NYSE Bullish % Indicator jumped to
72.26% on June 6; following a Bull
Correction buy signal (April 3).
Market Strategy
Short-term: Long if the S&P 500 is above 1000.
Intermediate: Long if the S&P is above 1000.
Long-term: Long - the S&P 500 primary trend has turned upwards after two bull signals: the March 17 follow through day and the April 3 NYSE Bullish % signal.
Intermediate: Long if the S&P is above 1000.
Long-term: Long - the S&P 500 primary trend has turned upwards after two bull signals: the March 17 follow through day and the April 3 NYSE Bullish % signal.
Freddie Mac fires top two
The mortgage giant fired its president and chief financial officer for failing to cooperate with the audit committee reviewing past results. (more)
The mortgage giant fired its president and chief financial officer for failing to cooperate with the audit committee reviewing past results. (more)
Motorola hit by SARS
The mobile phone maker blames poor market conditions in China for weak results. (more)
The mobile phone maker blames poor market conditions in China for weak results. (more)
Pound stays
Chancellor of the Exchequer Gordon Brown tells parliament that Britain is not ready to adopt the euro, but says that the decision will be reviewed in 2004. (more)
Chancellor of the Exchequer Gordon Brown tells parliament that Britain is not ready to adopt the euro, but says that the decision will be reviewed in 2004. (more)
Gold
New York (17.50): Spot gold has declined to $US 361.30.
On the five-year chart gold is above the long-term upward trendline.
New York (17.50): Spot gold has declined to $US 361.30.
On the five-year chart gold is above the long-term upward trendline.
ASX Australia
The ASX was closed Monday.
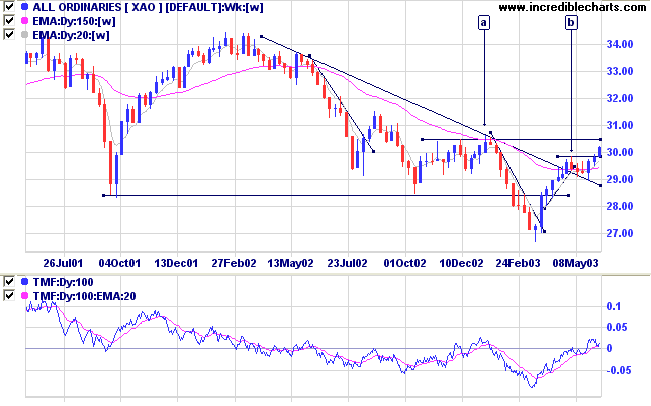
The intermediate trend is up.
The primary trend is down. A close above 3050 will signal an up-trend.
The monthly Coppock indicator has turned up below zero, signaling the start of a bull market.
Twiggs Money Flow (100) has crossed to above zero, signaling accumulation.
MACD (26,12,9) is above its signal line; Slow Stochastic (20,3,3) is above its signal line; and Twiggs Money Flow (21) signals accumulation.
Market Strategy
Short-term: Long if the All Ords rises above 3021; short if the
XAO falls below 2908.
Intermediate: Long if the primary trend reverses up ( closes above 3050 ); short if the XAO is below 2908.
Long-term: There is already a bull signal: the March 18 follow through. Wait for confirmation from a primary trend reversal.
Intermediate: Long if the primary trend reverses up ( closes above 3050 ); short if the XAO is below 2908.
Long-term: There is already a bull signal: the March 18 follow through. Wait for confirmation from a primary trend reversal.
Westpac [WBC]
Last covered on May 8, 2003.
Westpac has pulled back strongly after testing resistance at 16.90.
Twiggs Money Flow (100) and Twiggs Money Flow (21) both show bearish divergences.
Last covered on May 8, 2003.
Westpac has pulled back strongly after testing resistance at 16.90.
Twiggs Money Flow (100) and Twiggs Money Flow (21) both show bearish divergences.
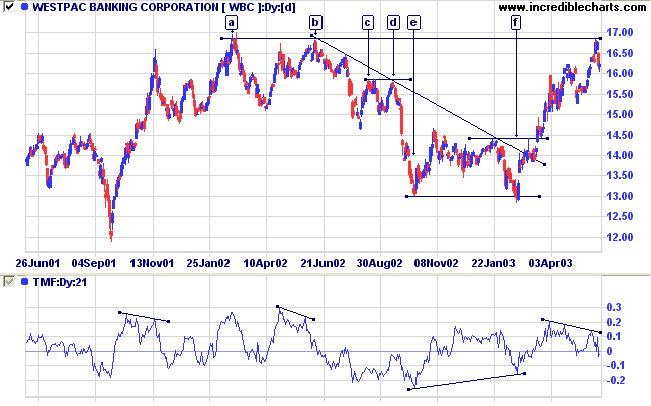
Double tops and double bottoms occur fairly
frequently on the above chart:
- [a]-[b] signaled the end of a primary up-trend;
- [c]-[d] gave a strong continuation signal in the down-trend;
- [e]-[f] signaled a reversal back to an up-trend (the false break at [f] strengthened the signal).
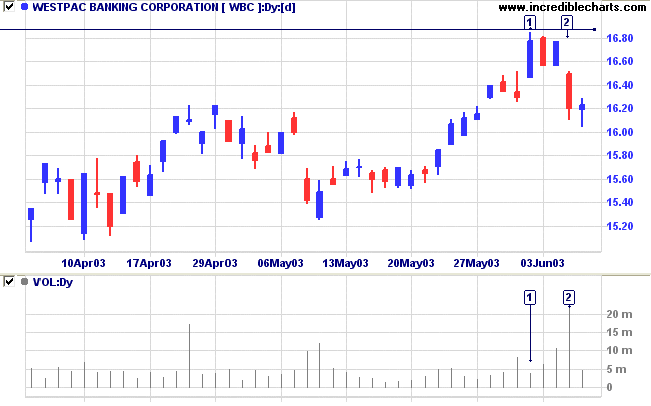
The last rally at [1] displayed weak
volume.
Volume strengthened on the pull-back, peaking with the downward gap at [2].
The doji candle on the following day indicates that the gap may have exhausted short-term momentum and another rally is likely.
If the rally is on thin volume and forms an equal or lower high, we may see the start of a secondary correction (intermediate down-trend).
A break above 16.90 would be bullish, but I would wait for a pull-back before taking further long entries.
Understanding
the Trading Diary has been expanded to offer further
assistance to readers.
Colin Twiggs
Success depends upon staying power.
The reason for failure in most cases is lack of perseverance.
- James Russell Miller.
The reason for failure in most cases is lack of perseverance.
- James Russell Miller.
Back Issues
Click here to access the Daily Trading Diary Archives.
Click here to access the Daily Trading Diary Archives.
Back Issues
Access the Trading Diary Archives.

Author: Colin Twiggs is a former investment banker with almost 40 years of experience in financial markets. He co-founded Incredible Charts and writes the popular Trading Diary and Patient Investor newsletters.
Using a top-down approach, Colin identifies key macro trends in the global economy before evaluating selected opportunities using a combination of fundamental and technical analysis.
Focusing on interest rates and financial market liquidity as primary drivers of the economic cycle, he warned of the 2008/2009 and 2020 bear markets well ahead of actual events.
He founded PVT Capital (AFSL No. 546090) in May 2023, which offers investment strategy and advice to wholesale clients.