Subscribe by 31 May 2003.
The Daily Trading Diary will only be available to Premium members.
We have extended the cut-off until mid-May - to fit in with the introduction of US charts.
Trading Diary
May 8, 2003
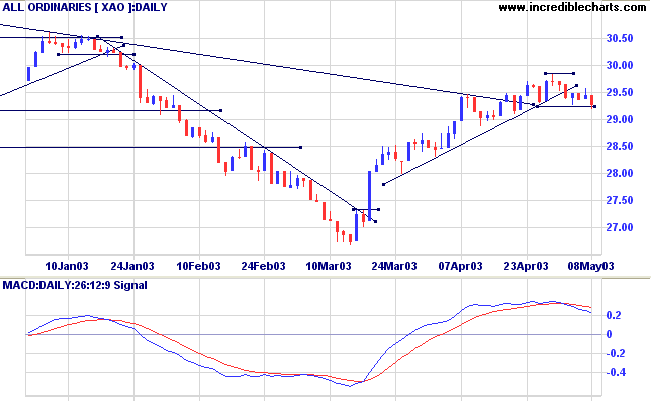
The intermediate trend is down. I prefer to wait for a clear break above resistance (8600) to signal the start of an up-trend. A fall below 8328 will signal continuation.
The primary trend is down; a rise above 9076 will signal a reversal.
The S&P 500 fell 9 points to close at 920.
The slow intermediate up-trend continues, with resistance overhead at 935.
The primary trend is down; a rise above 954 will signal a reversal.
The Nasdaq Composite retreated 1.1% to close at 1489.
The intermediate trend is up, with resistance overhead at 1521.
The primary trend is up.
The Chartcraft NYSE Bullish % Indicator continues to rise, reaching 56.99% on May 7, following a Bull Correction buy signal on April 3.
Long-term: There are already two bull signals: the March 17 follow through day and the April 3 NYSE Bullish % signal. Wait for confirmation from a Dow/S&P primary trend reversal.
New jobless claims fell to 425,000 for the week ended May 3; below expectations but still above the 400,000 benchmark. (more)
New York (16.44): Spot gold rallied strongly to $US 348.10.
On the five-year chart gold has respected the long-term upward trendline.
The intermediate up-trend is weakening; a break below Monday's low of 2926 will signal a reversal.
The primary trend is down. A rise above 3062 will signal reversal to an up-trend.
MACD (26,12,9) and Slow Stochastic (20,3,3) are below their signal lines and the Stochastic has fallen below 80%, a further bear signal; Twiggs Money Flow (21) is falling.
Long-term: There is already a bull signal: the March 18 follow through. Wait for confirmation from a primary trend reversal.
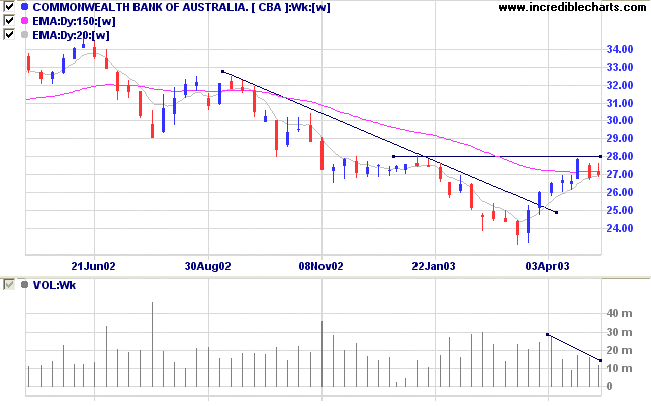
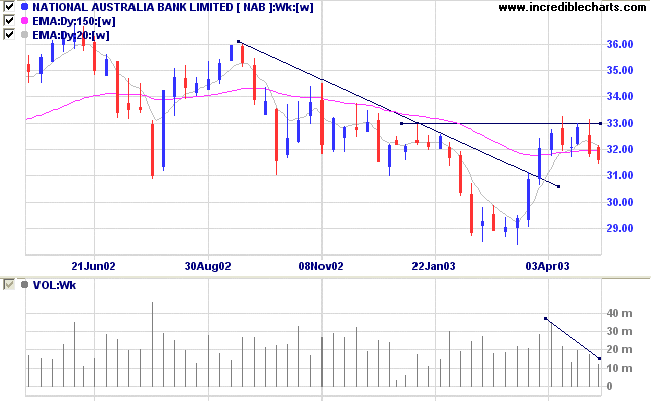
The financial index (excl. property) XXJ displays a strong bear signal, with a break below support at [1] after a weak rally at [2].
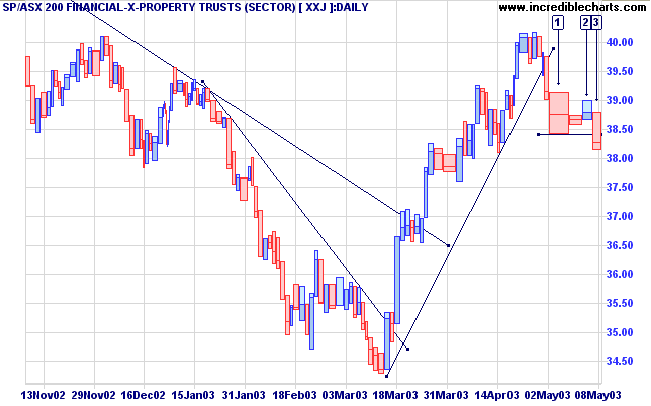
Examining weekly volume, we can see that volume declined towards the end of the last rally.
History may not repeat itself, but it does
rhyme a lot.
- Samuel L Clemens (Mark Twain).
Click here to access the Trading Diary Archives.
Back Issues

Author: Colin Twiggs is a former investment banker with almost 40 years of experience in financial markets. He co-founded Incredible Charts and writes the popular Trading Diary and Patient Investor newsletters.
Using a top-down approach, Colin identifies key macro trends in the global economy before evaluating selected opportunities using a combination of fundamental and technical analysis.
Focusing on interest rates and financial market liquidity as primary drivers of the economic cycle, he warned of the 2008/2009 and 2020 bear markets well ahead of actual events.
He founded PVT Capital (AFSL No. 546090) in May 2023, which offers investment strategy and advice to wholesale clients.