
To find out more about US indexes
follow the links on the Indexes
page.
Trading Diary
June 5, 2003
These extracts from my daily trading diary are
intended to illustrate the techniques used in short-term trading
and should not be interpreted as investment advice. Full terms
and conditions can be found at Terms
of Use .
USA
The Dow formed an inside day, closing at 9041 on higher volume. The index has held above the new 9000 support level.
The intermediate trend is up.
The primary up-trend is up.
The Dow formed an inside day, closing at 9041 on higher volume. The index has held above the new 9000 support level.
The intermediate trend is up.
The primary up-trend is up.
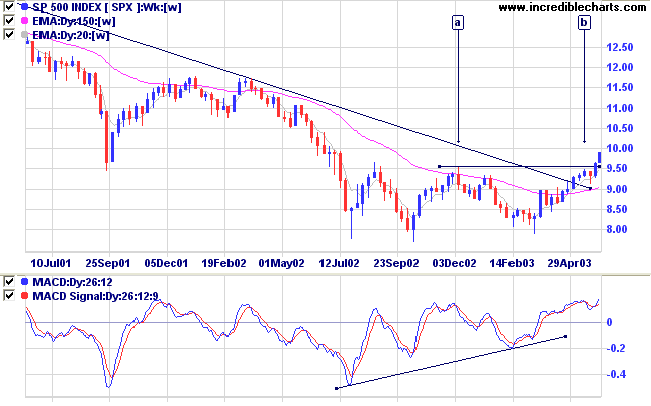
The S&P 500 gained 4 points to close at 990.
The intermediate trend is up.
The primary trend is up.
The intermediate trend is up.
The primary trend is up.
The Nasdaq Composite gained 0.7% to close at 1646.
The intermediate trend is up.
The index is in a primary up-trend.
The intermediate trend is up.
The index is in a primary up-trend.
The Chartcraft NYSE Bullish % Indicator rallied
to 69.26% on June 4; following a Bull
Correction buy signal (April 3).
Market Strategy
Short-term: Long if the S&P 500 is above 979.
Intermediate: Long if the S&P is above 979.
Long-term: Long - the S&P 500 primary trend has turned upwards after two bull signals: the March 17 follow through day and the April 3 NYSE Bullish % signal.
Intermediate: Long if the S&P is above 979.
Long-term: Long - the S&P 500 primary trend has turned upwards after two bull signals: the March 17 follow through day and the April 3 NYSE Bullish % signal.
Unemployment up
New job claims jumped to 442,000 for the week ended 31 May, from a revised 426,000 a week earlier. (more)
New job claims jumped to 442,000 for the week ended 31 May, from a revised 426,000 a week earlier. (more)
Gold
New York (16.30): Spot gold recovered to $US 368.30.
On the five-year chart gold is above the long-term upward trendline.
New York (16.30): Spot gold recovered to $US 368.30.
On the five-year chart gold is above the long-term upward trendline.
ASX Australia
The monthly Coppock indicator has turned up below zero, signaling
the start of a bull market.
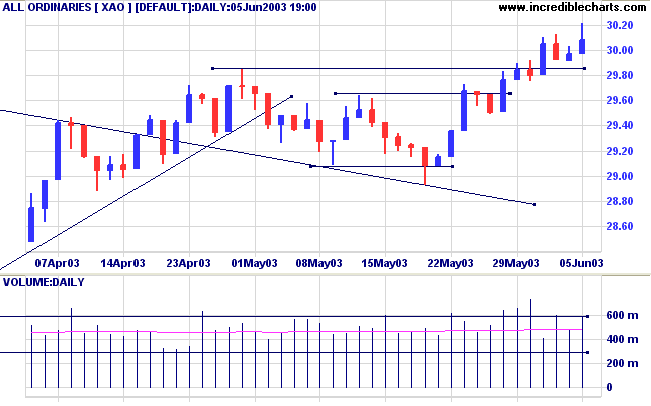
The All Ordinaries closed up 11 points at 3008 on strong volume.
The long upper shadow indicates short-term weakness.
The intermediate trend is up.
The primary trend is down. A close above 3050 will signal an up-trend.
MACD (26,12,9) is above its signal line, having completed a bullish trough above zero; Slow Stochastic (20,3,3) is below its signal line; and Twiggs Money Flow (21) continues to signal accumulation.
The intermediate trend is up.
The primary trend is down. A close above 3050 will signal an up-trend.
MACD (26,12,9) is above its signal line, having completed a bullish trough above zero; Slow Stochastic (20,3,3) is below its signal line; and Twiggs Money Flow (21) continues to signal accumulation.
Market Strategy
Short-term: Long if the All Ords rises above 3021; short if the
XAO falls below 2908.
Intermediate: Long if the primary trend reverses up ( closes above 3050 ); short if the XAO is below 2908.
Long-term: There is already a bull signal: the March 18 follow through. Wait for confirmation from a primary trend reversal.
Intermediate: Long if the primary trend reverses up ( closes above 3050 ); short if the XAO is below 2908.
Long-term: There is already a bull signal: the March 18 follow through. Wait for confirmation from a primary trend reversal.
Telecom NZ [TEL]
Last covered on May 14, 2003.
TEL has formed a broad base over the last 18 months.
It recently broke above resistance but then slipped back below.
Twiggs Money Flow (100) shows strong accumulation, holding above zero.
Last covered on May 14, 2003.
TEL has formed a broad base over the last 18 months.
It recently broke above resistance but then slipped back below.
Twiggs Money Flow (100) shows strong accumulation, holding above zero.
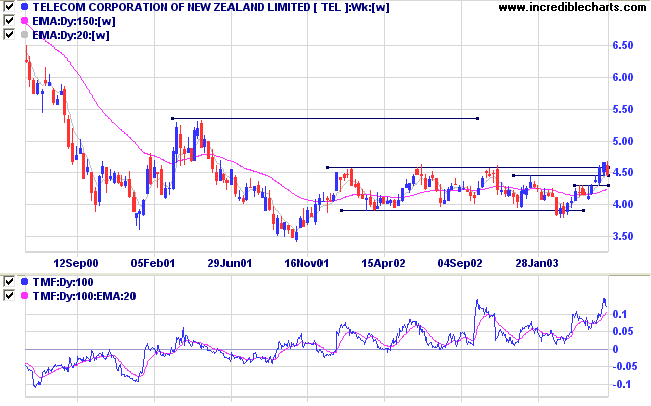
MACD (26,12,9) has completed a bullish trough above the zero
line.
The recent correction on the Relative Strength (price ratio: xao) line is still above the previous peak: a bullish sign if it is able to complete a trough above the last peak. In the longer term the line is slowly rising.
Twiggs Money Flow (21) signals accumulation.
Price penetrated resistance at 4.60 but then slipped back below, testing support at 4.40.
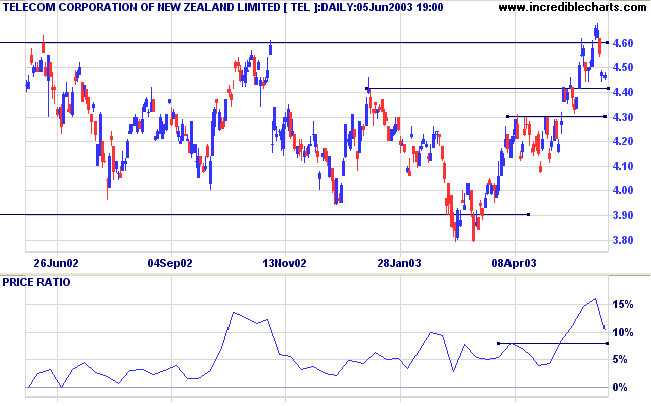
Equivolume highlights resistance at 4.60, with
heavy volume and a long shadow at [i].
The pull-back to [j] was bullish, with low volume and short duration.
On the next rally, price broke through resistance at [k]. The square bar, heavy volume but smallish range, indicates selling pressure.
Price then broke below support on fair volume at [l].
The downward gap exhausted momentum, with weak closes and low volume at [m].
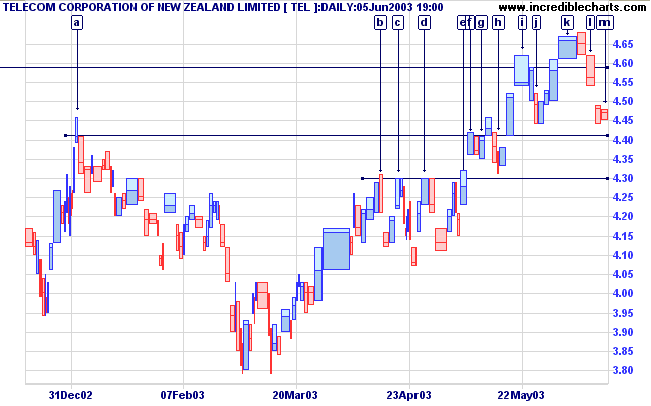
A break below 4.30 would be a strong bear signal.
Consolidation above 4.30 would be bullish. Another break above 4.60 will be a strong bull signal.
Consolidation above 4.30 would be bullish. Another break above 4.60 will be a strong bull signal.
Understanding
the Trading Diary has been expanded to offer further
assistance to readers.
Colin Twiggs
Whenever you find that you are on the side of
the majority,
it is time to reform.
- Samuel L Clemens (Mark Twain).
it is time to reform.
- Samuel L Clemens (Mark Twain).
Back Issues
Click here to access the Trading Diary Archives.
Click here to access the Trading Diary Archives.

Author: Colin Twiggs is a former investment banker with almost 40 years of experience in financial markets. He co-founded Incredible Charts and writes the popular Trading Diary and Patient Investor newsletters.
Using a top-down approach, Colin identifies key macro trends in the global economy before evaluating selected opportunities using a combination of fundamental and technical analysis.
Focusing on interest rates and financial market liquidity as primary drivers of the economic cycle, he warned of the 2008/2009 and 2020 bear markets well ahead of actual events.
He founded PVT Capital (AFSL No. 546090) in May 2023, which offers investment strategy and advice to wholesale clients.