Subscribe by 31 May 2003.
The Daily Trading Diary will only be available to Premium members.
We have extended the cut-off until mid-May - to fit in with the introduction of US charts.
Trading Diary
May 14, 2003
The intermediate trend is up.
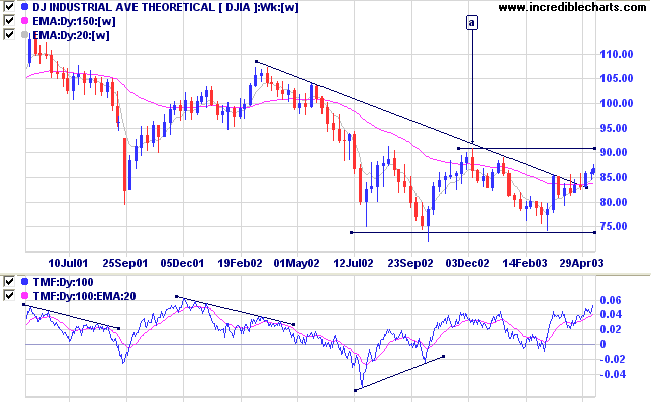
The primary trend is down; a rise above 9076 [a] will signal a reversal.
The intermediate up-trend continues.
The primary trend is down; a rise above 954 will signal an up-trend.
The Nasdaq Composite lost 0.3% to close at 1534.
The intermediate trend is up.
The break above 1521 provides clear confirmation that the index is in a primary up-trend.
The Chartcraft NYSE Bullish % Indicator continues to climb, reaching 59.47% on May 13, following a Bull Correction buy signal on April 3.
Long-term: There are already two bull signals: the March 17 follow through day and the April 3 NYSE Bullish % signal. Wait for confirmation from a Dow/S&P primary trend reversal.
New York (17.56): Spot gold is back up at $US 352.30.
On the five-year chart gold has respected the long-term upward trendline.
The intermediate up-trend is weak; a close below 2909 will signal a reversal.
The primary trend is down. A rise above 3062 will signal an up-trend.
MACD (26,12,9) is below its signal line; Slow Stochastic (20,3,3) has crossed to above; Twiggs Money Flow (21) is weakening.
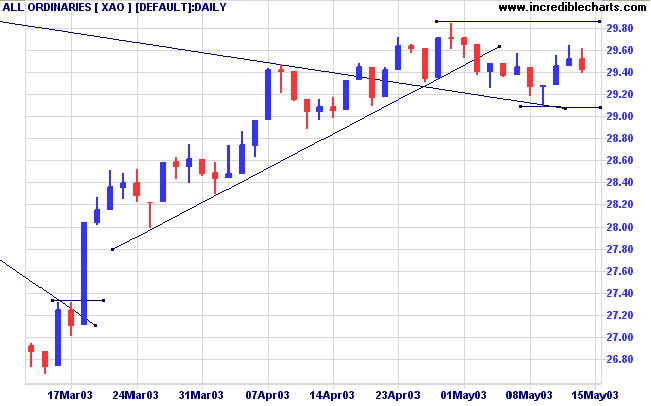
Intermediate: Long if the primary trend reverses up (XAO above 3062); short if the intermediate trend reverses down (falls below 2909).
Long-term: There is already a bull signal: the March 18 follow through. Wait for confirmation from a primary trend reversal.
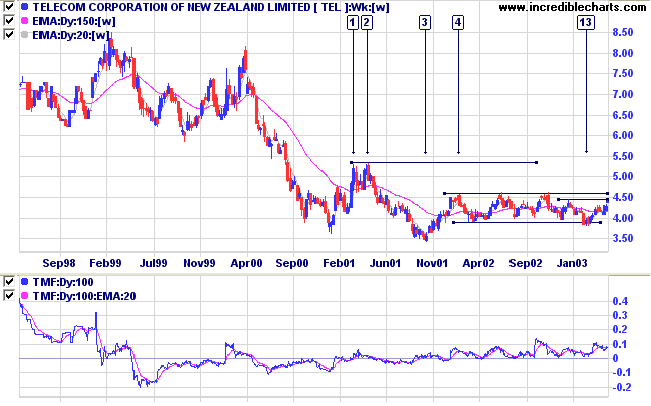
TEL is building a broad stage 1 base, from [4] to [13], after a lengthy stage 4 down-trend.
The stock made a marginal break below support at [13] before rallying to test resistance at 4.40.
Twiggs Money Flow (100-day) signals strong accumulation.
The equivolume chart shows that TEL made several tests of resistance at 4.30, from [b] to [e], before price gapped up at [f].
The pull-back to [g] shows signs of ending and there may be entry opportunities (short-term) if TEL rises above 4.41.
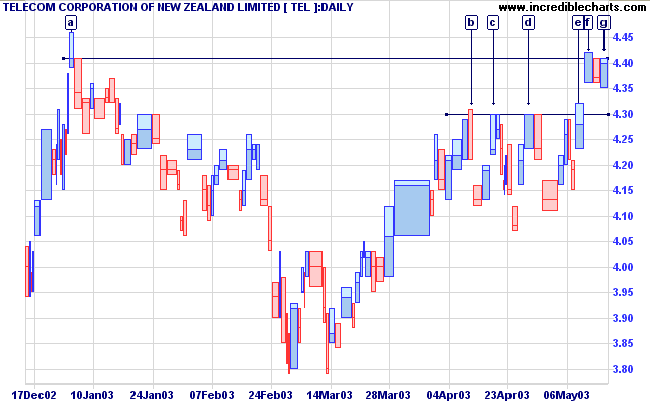
- the pull-back is short;
- on low volume; and
- respects support at 4.30.
Longer-term traders may prefer to wait for a break above resistance at 4.60.
Millions saw the apple fall,
but Newton was the one who asked why.
- Bernard Baruch.
Click here to access the Trading Diary Archives.
Back Issues

Author: Colin Twiggs is a former investment banker with almost 40 years of experience in financial markets. He co-founded Incredible Charts and writes the popular Trading Diary and Patient Investor newsletters.
Using a top-down approach, Colin identifies key macro trends in the global economy before evaluating selected opportunities using a combination of fundamental and technical analysis.
Focusing on interest rates and financial market liquidity as primary drivers of the economic cycle, he warned of the 2008/2009 and 2020 bear markets well ahead of actual events.
He founded PVT Capital (AFSL No. 546090) in May 2023, which offers investment strategy and advice to wholesale clients.