The new version is now available. See What's New? for details.
Incredible Charts will automatically update to the new version when you log in.
To check that you have the latest version, select Help >> About on Incredible Charts menu.
Trading Diary
November 11, 2002
The Nasdaq Composite Index was down 3% at 1319. The primary trend will reverse (up) if the index breaks above 1426.
The S&P 500 lost 18 points to close at 876. The primary trend will complete a double bottom reversal if it rises above 965.
The Chartcraft NYSE Bullish % Indicator signals a bull alert at 40% (November 08).
Former Compaq CEO Michael Capellas is to depart from Hewlett-Packard, and possibly join WorldCom. (more)
Warren Buffett's Berkshire Hathaway is reported to be considering a bid for GE's reinsurance unit.(more)
Gold
New York: Spot gold is up 10 cents at $US 321.10.
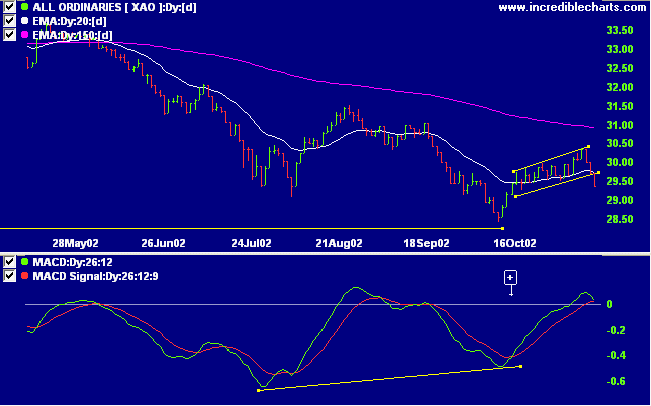
The Slow Stochastic (20,3,3) is below its signal line, MACD (26,12,9) is above, while Twiggs money flow signals distribution.
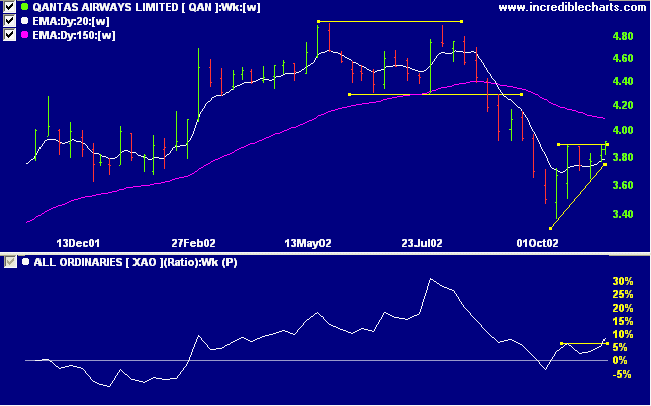
Last covered on September 30.
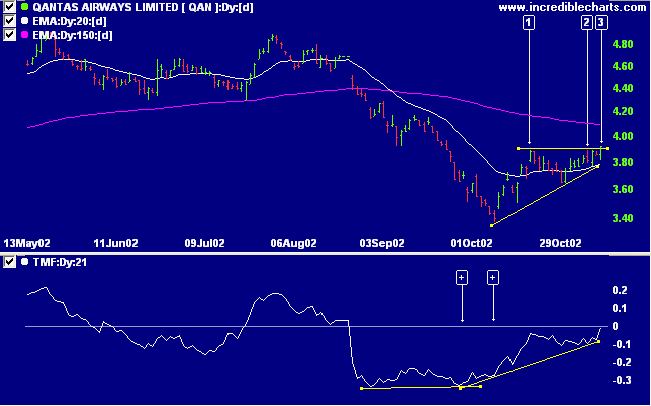
After two equal highs in May and August, QAN completed a double top reversal and entered a steep dive. In October the stock rose off its lows to form a bullish ascending triangle. Relative strength (price ratio: xao) is rising.
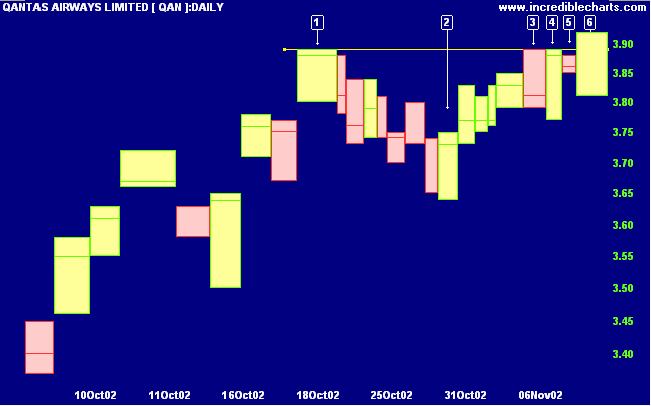
A break below the low of [6] at 3.81 would be a bearish signal.
He who thinks that he knows, doesn't
know.
He who knows that he doesn't know, knows.
- Lao Tse.
Back Issues

Author: Colin Twiggs is a former investment banker with almost 40 years of experience in financial markets. He co-founded Incredible Charts and writes the popular Trading Diary and Patient Investor newsletters.
Using a top-down approach, Colin identifies key macro trends in the global economy before evaluating selected opportunities using a combination of fundamental and technical analysis.
Focusing on interest rates and financial market liquidity as primary drivers of the economic cycle, he warned of the 2008/2009 and 2020 bear markets well ahead of actual events.
He founded PVT Capital (AFSL No. 546090) in May 2023, which offers investment strategy and advice to wholesale clients.