Chart Patterns - Targeted moves
In response to email questions from readers:
The targeted move is the projected price move for a particular chart pattern.
I do not make predictions: the market can go up or down at any time; it is only the probability (of each move) that varies. If a pattern is described as bullish, it means that the market has a higher probability of rising than of falling, and the opposite if a pattern is bearish.
Trading Diary
November 05, 2002
These extracts from my daily trading diary are
intended to illustrate the techniques used in short-term trading
and should not be interpreted as investment advice. Full terms
and conditions can be found at Terms
of Use .
USA
The Dow rose to 8678, up 1.2% on lower volume,
continuing the secondary rally. The primary trend will reverse if
the index rises above 9130.
The Nasdaq Composite Index opened lower but later rallied to close up 5 points at 1401. The primary trend will reverse if the index breaks above 1426.
The S&P 500 gained 7 points to close at 915. The primary trend is down, but the index will complete a double bottom reversal if it rises above 965.
The Chartcraft NYSE Bullish % Indicator signals a bull alert at 40%.
Rate cut expected
The market is pricing in a quarter point rate cut ahead of the Fed's Wednesday meeting. (more)
Gold
New York: Spot gold declined 130 cents to $US 317.10.
The market is pricing in a quarter point rate cut ahead of the Fed's Wednesday meeting. (more)
Gold
New York: Spot gold declined 130 cents to $US 317.10.
ASX Australia
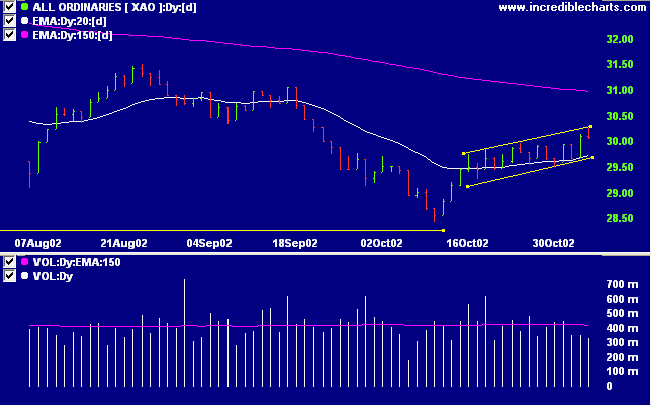
The All Ordinaries rallied higher before late selling closed at
3008, 1 point down on reassuringly low volume. The upward
sloping flag is a bullish continuation pattern. The primary
trend will reverse if the index rises above 3150.
The Slow Stochastic (20,3,3) and MACD (26,12,9) are above their signal lines, while Twiggs money flow is close to zero.
The Slow Stochastic (20,3,3) and MACD (26,12,9) are above their signal lines, while Twiggs money flow is close to zero.
Gas Utilities
Five Gas Utilities stocks popped up on my screen of stocks close to their 6-month highs:
Five Gas Utilities stocks popped up on my screen of stocks close to their 6-month highs:
- Gasnet
- Alinta Gas
- Australian Gas Light
- Envestra
- Australian Pipeline Trust.
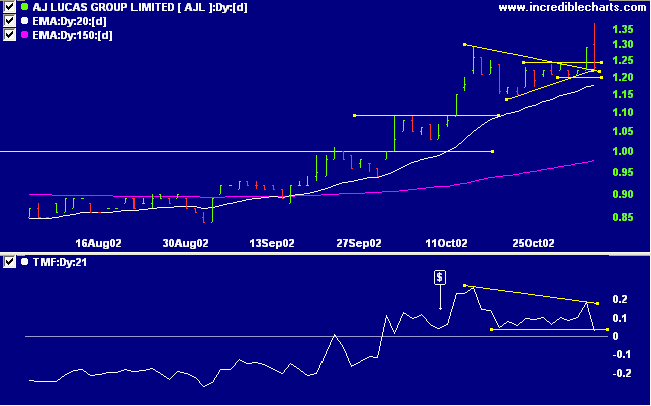
AJ Lucas [AJL]
Last covered on November 1st.
AJL broke above 1.24 on Monday to post a healthy gain with strong volume. On Tuesday it was "Houston, we have a problem": the stock corrected sharply on heavy selling, closing below the support line, at 1.23. Twiggs money flow dipped below the previous low.
Last covered on November 1st.
AJL broke above 1.24 on Monday to post a healthy gain with strong volume. On Tuesday it was "Houston, we have a problem": the stock corrected sharply on heavy selling, closing below the support line, at 1.23. Twiggs money flow dipped below the previous low.
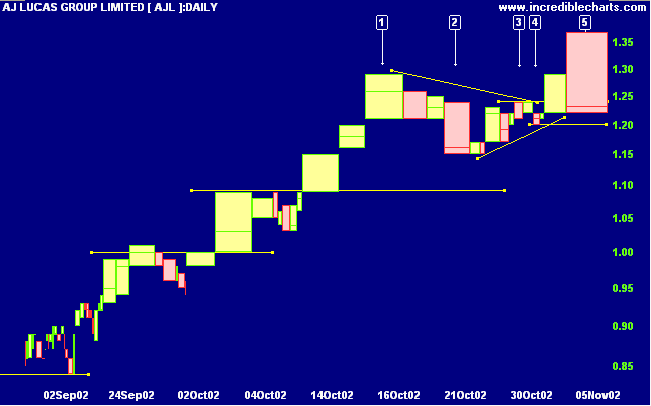
On the equivolume chart you can see the 1.24
support/resistance level at [3]. The logical placement of a
stop-loss would be two ticks below the recent low of 1.20 at
[4]. The risk is that AJL falls below the support level at [4],
commencing a bull-trap. The strength of the selling pressure is
signaled by the width of the bar at [5] and the low close -
sellers are in control.
Do I close out the position or wait for the stop-loss to be taken out, increasing the loss? Despite the market being fairly bullish, my decision is to move the stop loss up to 1.21, below the low of 1.22 on day [5]. This motivated by the heavy selling volume and the words of Edward Lefevre:
Let him buy one-fifth of his full line. If that does not show him a profit he must not increase his holdings because he has obviously begun wrong; he is wrong temporarily and there is no profit in being wrong at any time.
Back Issues
Do I close out the position or wait for the stop-loss to be taken out, increasing the loss? Despite the market being fairly bullish, my decision is to move the stop loss up to 1.21, below the low of 1.22 on day [5]. This motivated by the heavy selling volume and the words of Edward Lefevre:
Let him buy one-fifth of his full line. If that does not show him a profit he must not increase his holdings because he has obviously begun wrong; he is wrong temporarily and there is no profit in being wrong at any time.
Short-term: Take new entries where stops are tight. The Slow
Stochastic and MACD are above their respective signal lines,
but the Stochastic is in oversold territory.
Medium-term: Take new entries. Use stop losses to protect
yourself against a sudden reversal.
Long-term: Wait for confirmation of the
bottom reversal signal.
Colin Twiggs
Thought for the Day:
You get what you focus on.
- Anthony Robbins.
You get what you focus on.
- Anthony Robbins.
Back Issues
Click here to access the
Trading Diary Archives.
Back Issues
Access the Trading Diary Archives.

Author: Colin Twiggs is a former investment banker with almost 40 years of experience in financial markets. He co-founded Incredible Charts and writes the popular Trading Diary and Patient Investor newsletters.
Using a top-down approach, Colin identifies key macro trends in the global economy before evaluating selected opportunities using a combination of fundamental and technical analysis.
Focusing on interest rates and financial market liquidity as primary drivers of the economic cycle, he warned of the 2008/2009 and 2020 bear markets well ahead of actual events.
He founded PVT Capital (AFSL No. 546090) in May 2023, which offers investment strategy and advice to wholesale clients.