Gold Rebounds to $800
By Colin Twiggs
November 22, 2:00 a.m. ET (5:00 p.m. AET)
These extracts from my trading diary are for educational purposes and should not be interpreted as investment or trading advice. Full terms and conditions can be found at Terms of Use.
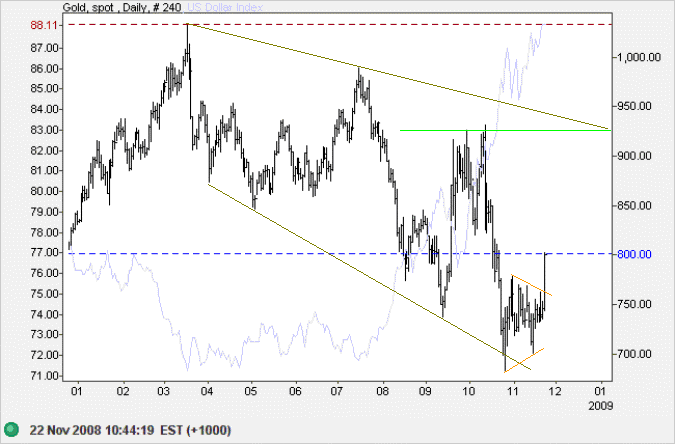
Spot gold broke out above its recent triangle to test resistance at $800. This comes as a bit of a surprise because gold normally moves inversely to the US dollar index, which has not weakened. I also warned during the week that gold was likely to weaken in sympathy with crude oil, with oil producers selling off investments to maintain existing expenditure levels.
Expect retracement to test the new support level at $750. Breakout above $800 would indicate a rally to the upper border of the descending broadening wedge. The primary trend is down, however, and a failed swing that does not reach the upper border would be a long-term bear signal.
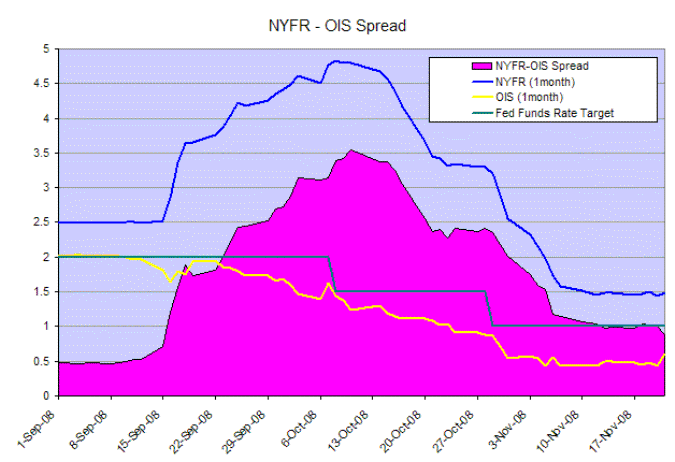
Interbank Spreads
The New York Funds Rate (1-month) remains at a healthy 50 basis points (0.50%) above the fed funds target rate. The Overnight Index Swap Rate, indicating traders best estimate of the effective fed funds rate, ticked up slightly but continues to point towards another 0.50 percent rate cut.
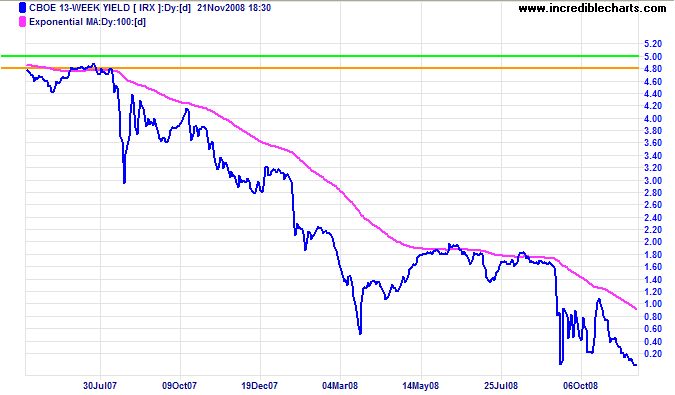
The market may be awash with liquidity but confidence remains at a low ebb. The yield on 13-week treasurys fell to a new low of 0.05 percent. Investors concerned about default risk are seeking safety over yield.
USA
Dow Jones Industrial Average
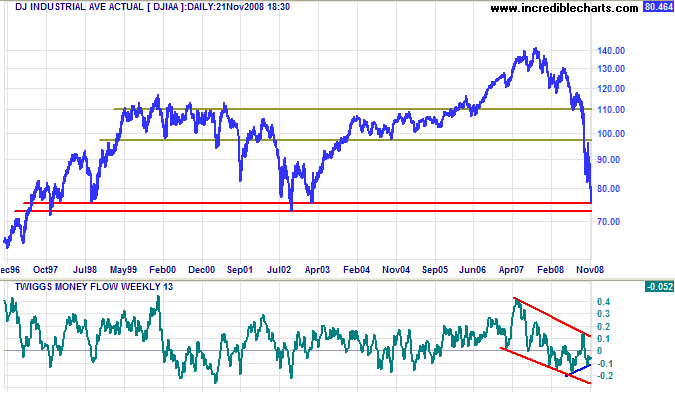
The Dow found support at 7500, retracing to test the new resistance level at 8000 accompanied by an upsurge in volume. Follow-through above the weekly high of 8500 would signal another test of 10000.
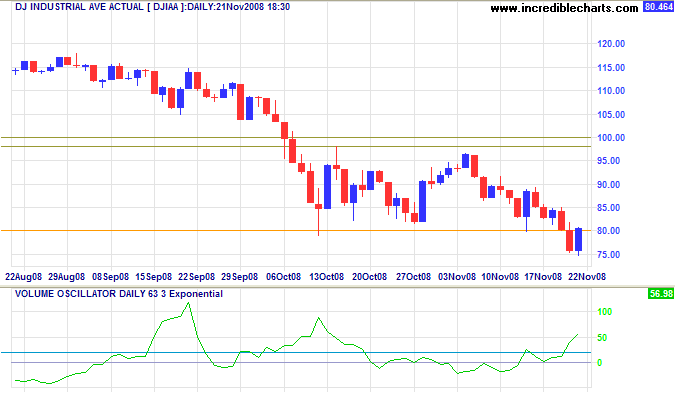
Long Term: The primary trend is down and penetration of the 2002 low of 7300 would offer a long-term target of 6000. This is calculated as 8000 - ( 10000 - 8000 ). Twiggs Money Flow (21-Day) remains below zero, indicating medium-term selling pressure. Recovery above 10000 is unlikely in the present climate.
S&P 500
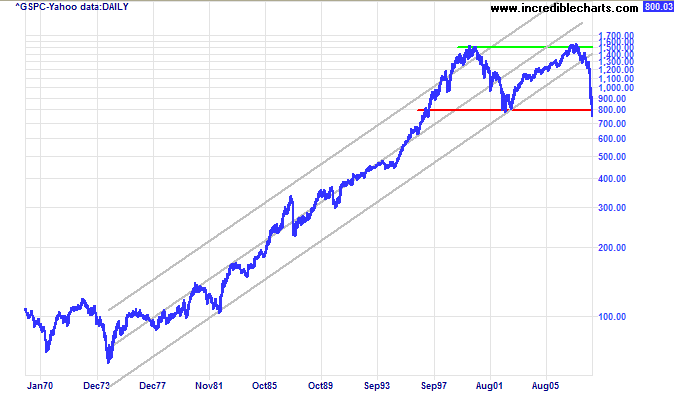
The S&P 500 broke through support at 800 but then retraced to test the new resistance level. Respect of resistance would indicate that we are entering a long-term bear phase, last experienced in the 1970s. Dow breakout below 7300 would confirm.
Transport
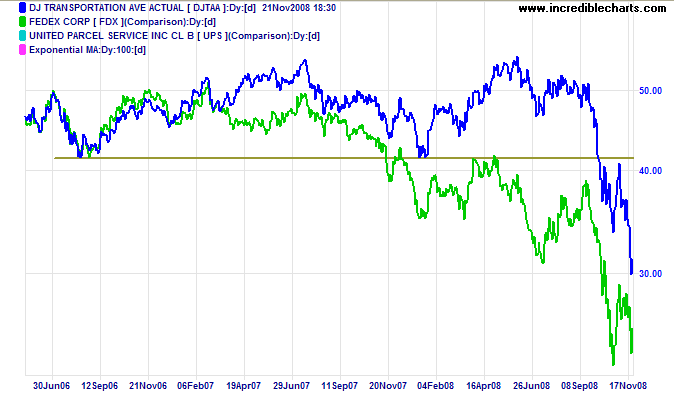
Fedex and the Transport Average are in strong primary down-trends. No recovery in sight.
Canada: TSX
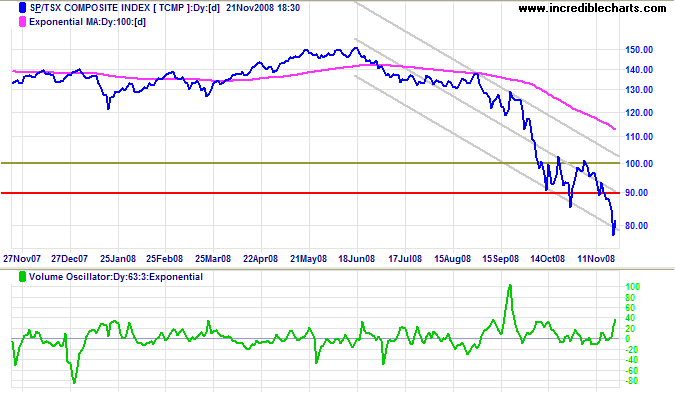
The TSX Composite found support at 8000 accompanied by rising volume and is likely to retrace to test resistance at 9000.
Reversal below 8000 would offer a target of 7000, calculated as
9000 - ( 11000 - 9000 ).
United Kingdom: FTSE
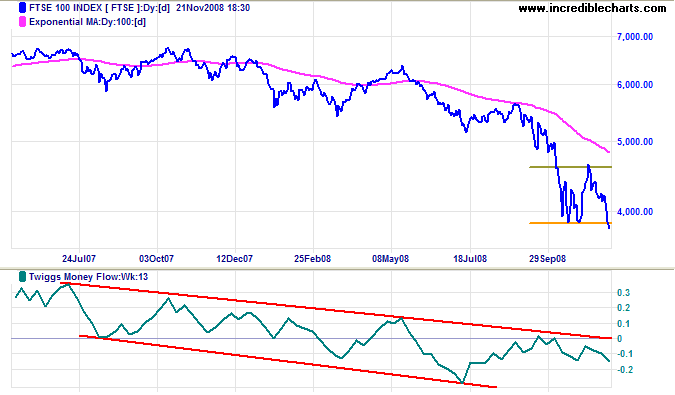
The FTSE 100 broke through support at 3850, offering a target of the 2003 low of 3300. The primary trend is down and Twiggs Money Flow (13-week) respected zero from below, indicating continued selling pressure.
Europe: DAX
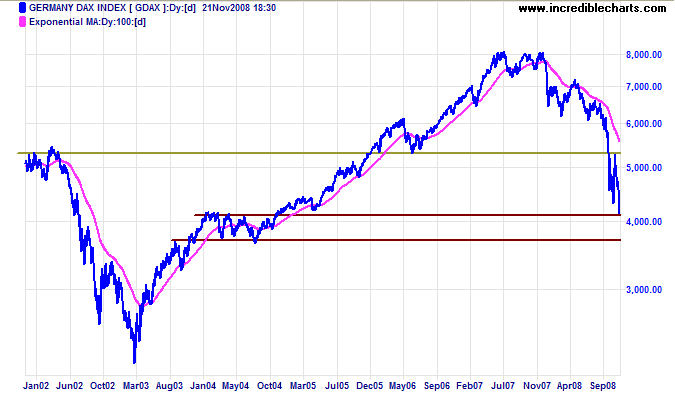
The DAX broke through support at 4300, signaling a test of the August 2004 low at 3600. The calculated target is lower at 3300. That is 4300 - ( 5300 - 4300 ).
India: Sensex
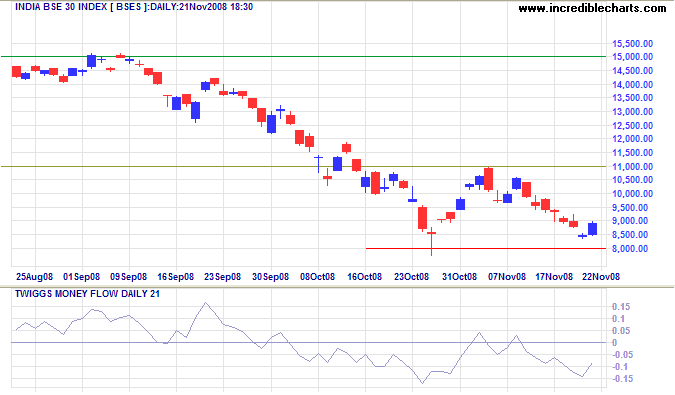
The Sensex is testing support between 8500 and 8000. Twiggs Money Flow (21-Day) holding below zero indicates weakness. In the short term, recovery above 9000 would signal a rally to test resistance at 11000, while penetration of 8000 would warn of another down-swing. In the long term, the primary trend is down and breakout below 8000 is likely, offering a target of 6000, the 2005 low; calculated as 8500 - ( 11000 - 8500 ). Reversal above 11000 is unlikely in the present climate.
Japan: Nikkei
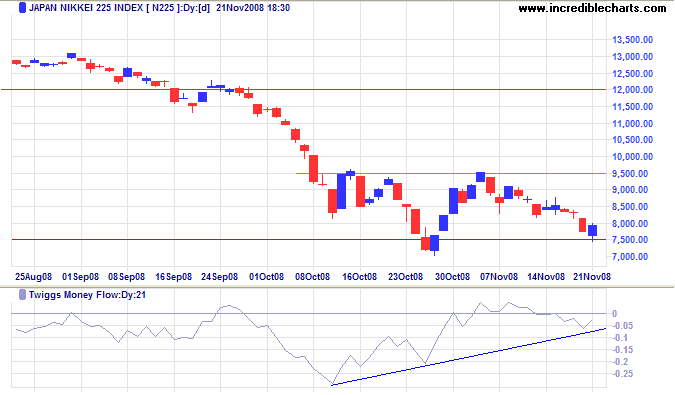
The Nikkei 225 is testing the long-term support level of 7500, the 2003 low. Respect would indicate another test of resistance at 9500, while failure would signal another down-swing. The rising trendline on Twiggs Money Flow (21-Day) shows short-term buying pressure. In the long term, the primary trend is down and reversal below the October low of 7000 is more likely, offering a target of 4500. Calculated as 7000 - ( 9500 - 7000 ).
China
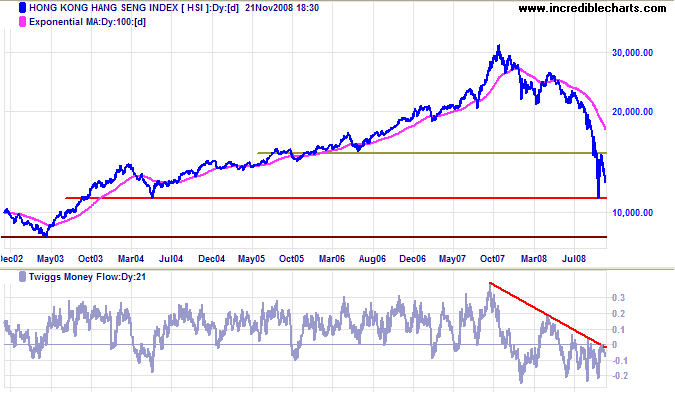
The Hang Seng respected resistance at 15000, retreating towards support at 11000. Twiggs Money Flow (21-Day) remains below zero, indicating selling pressure. In the long term, the primary trend is down and failure of support at 11000 would warn of a test of the 2003 low at 8500. Recovery above 15000 is unlikely in the present climate.
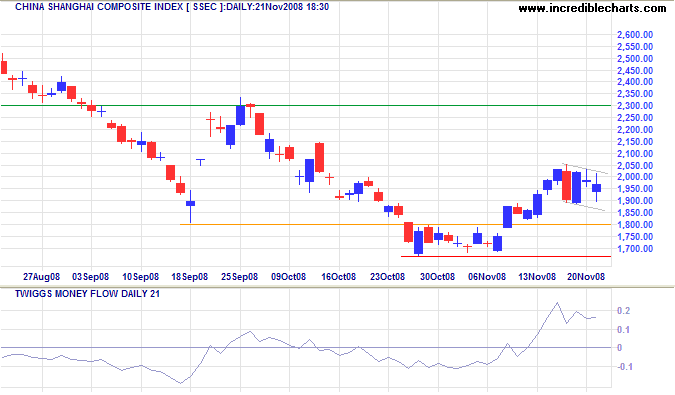
The Shanghai Composite commenced a short-term consolidation at 2000; resembling a flag at present. Twiggs Money Flow (21-day) signals strong short-term buying. Upward breakout is likely, which would signal a test of 2300. Downward breakout, while less likely, would test the October low of 1650. In the long term, continuation of the primary down-trend is more likely and breakout below 1650 would offer a target of 1300; calculated as 1800 - ( 2300 - 1800 ).
Australia: ASX
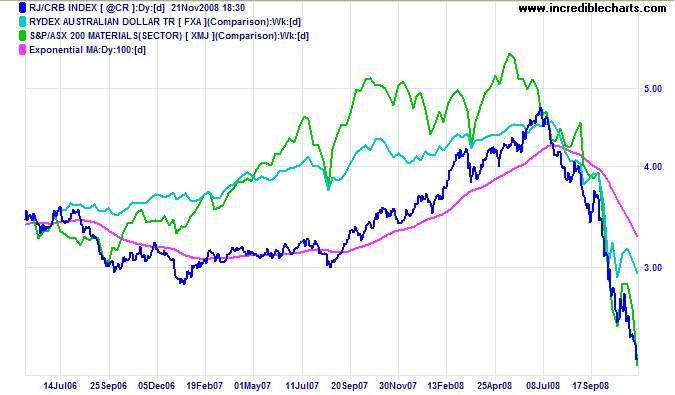
The CRB commodities index continues its descent, closely shadowed by the ASX Materials sector. The Australian dollar, supported by RBA purchases, is lagging at present, but is expected to show further weakness.
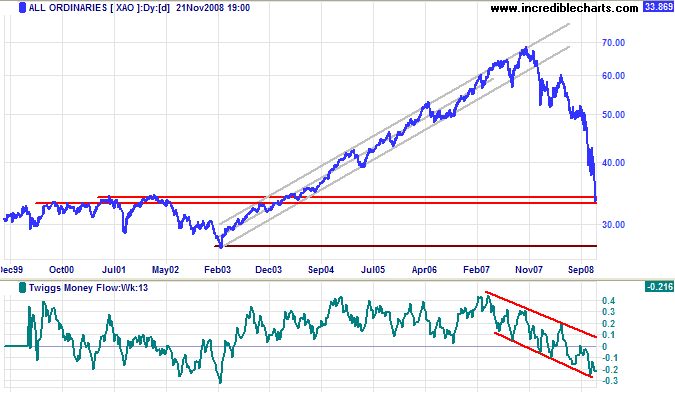
The All Ordinaries found support at 3300, accompanied by an upsurge in volume. Expect retracement to test the new resistance level at 3700.
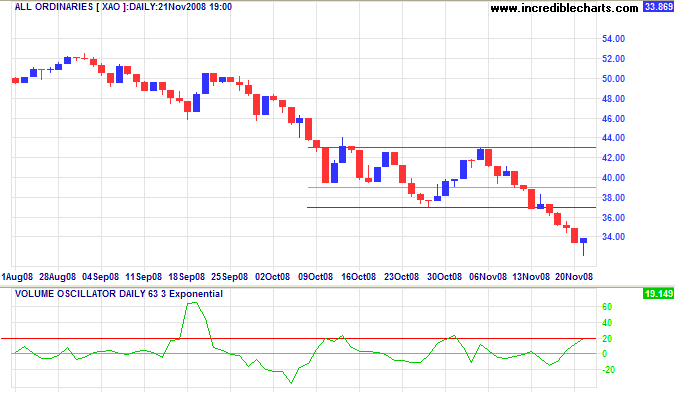
Long Term: The index reached the 50 percent retracement level at 3400, so expect some consolidation. Twiggs Money Flow (13-week) remains in a strong downward trend channel. The primary down-trend is likely to continue and breakout below 3300 would offer a target of 2700, the 2003 low.
The Great Depression, like most other periods of severe unemployment, was produced by government mismanagement rather than by any inherent instability of the private economy.
~ Milton Friedman
