|
Next Update |
|
Incredible Charts version 4.0.3.211 will be released next
week. |
Trading Diary
June 5, 2004
These extracts from my daily trading diary
are for educational purposes
and should not be interpreted as investment
advice. Full terms and conditions can be found at Terms
of Use.
USA
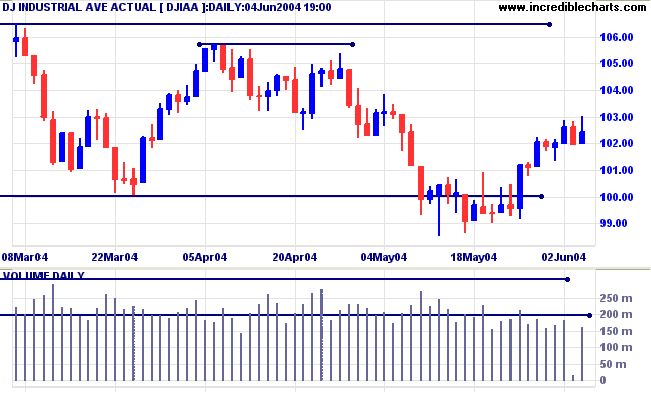
The Dow Industrial Average is still edging upwards but low
volume and Friday's weak close make the rally unconvincing.
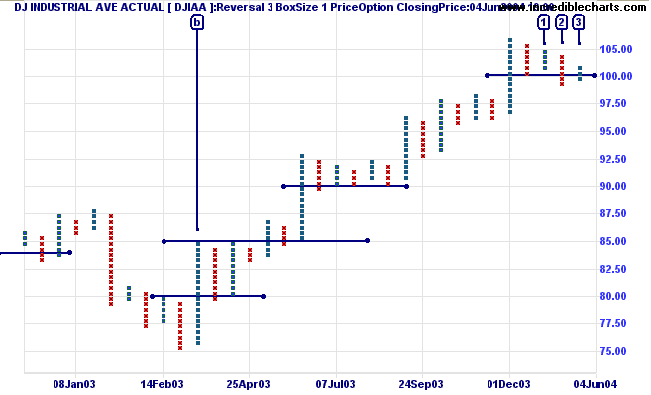
In the longer-term, the break below 10000 (at [2] on the P&F
chart) now appears to have been a false break, with the index
rallying back above resistance at [3]. A rally above the high of
[1] (at 10570) would signal resumption of the primary up-trend.
Failure to break above this level would be a bear signal.
Twiggs Money Flow (not shown) is still bearish.
Twiggs Money Flow (not shown) is still bearish.
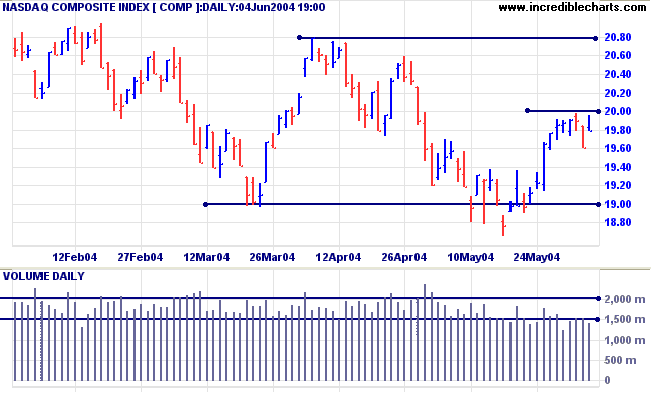
The Nasdaq Composite has encountered resistance at 2000
and lacks sufficient volume to penetrate this level.
Twiggs Money Flow continues to display a strong bear signal.
Twiggs Money Flow continues to display a strong bear signal.
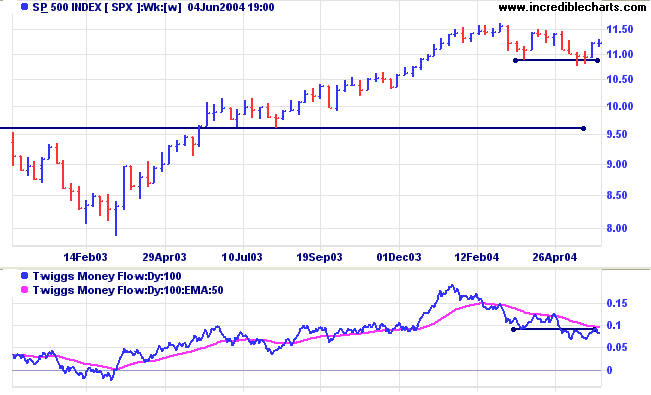
The S&P 500 is in a similar situation to the Dow:
consolidating on low volume after recovery above a key support
level (1090).
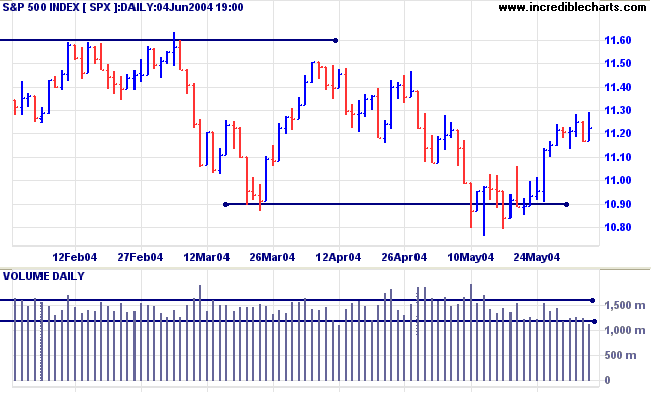
A clear break above resistance at 1150 would signal resumption of
the primary up-trend. Failure to break above this level would be
bearish.
Twiggs Money Flow continues to display a strong bear signal.
NYSE Bullish Percent Index
The Chartcraft Bullish Percent Index recovered to 62.07% but is still on Bear Alert status.
The Chartcraft Bullish Percent Index recovered to 62.07% but is still on Bear Alert status.
Treasury yields
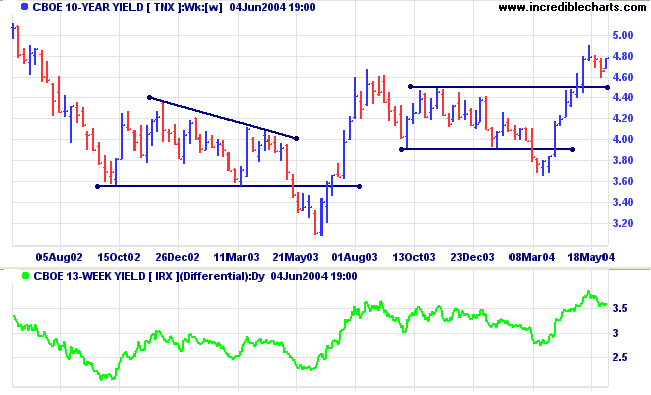
The yield on 10-year treasury notes appears to be consolidating above support at 4.50%. This would confirm the strength of the primary up-trend.
The yield differential (10-year T-notes minus 13-week T-bills) at 3.6% reflects imminent rates increases.
The yield on 10-year treasury notes appears to be consolidating above support at 4.50%. This would confirm the strength of the primary up-trend.
The yield differential (10-year T-notes minus 13-week T-bills) at 3.6% reflects imminent rates increases.
Gold
New York: Spot gold penetrated support at 390 before recovering to $390.60 shortly before Friday's close. A pull-back that respects support at 390 would signal a likely re-test of resistance at the previous 2004 highs. A break below support at 390 would indicate a bearish consolidation or slow down-trend.
New York: Spot gold penetrated support at 390 before recovering to $390.60 shortly before Friday's close. A pull-back that respects support at 390 would signal a likely re-test of resistance at the previous 2004 highs. A break below support at 390 would indicate a bearish consolidation or slow down-trend.

Incredible Charts - now with US
Data
|
FREE trial - Click Here
ASX Australia
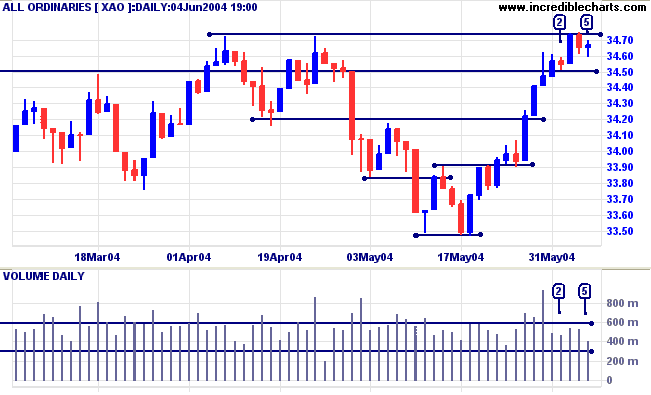
The All Ordinaries showed brief
consolidations at [2] and [5] on lower volume, after breaking
through resistance at 3450. This signals an absence of
selling pressure and we should see an attempt to establish a new
high in the next week.
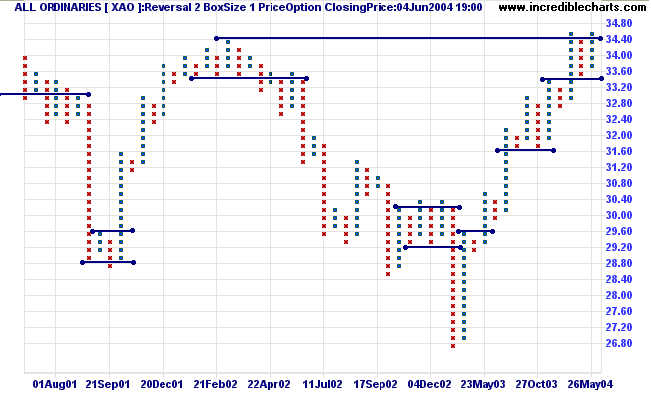
The index is not yet out of the woods. I would
like to see a significant new high (as opposed to a marginal
break of one box) followed by confirmation in the form of a
pull-back that respects the new support level. Only then will I
be convinced that we are back in a strong bull
market.
Volume over the last few days appears light; and Twiggs Money Flow (not shown) continues to display a bearish divergence.
Volume over the last few days appears light; and Twiggs Money Flow (not shown) continues to display a bearish divergence.
Point & Figure - Consolidation
Patterns
It is important to use a low reversal amount when scanning for consolidations. I find a reversal amount of 2 most useful for this purpose, being roughly equivalent to the method originally used by De Villiers & Taylor (The Point & Figure Method of Anticipating Stock Price Movements, 1933). Higher reversal amounts eliminate the narrow fluctuations found in most consolidations.
Narrow consolidations above and below support or resistance levels give important signals about buyer and seller behavior. I first discovered their importance when reading Schwager on Futures: Technical Analysis by Jack Schwager.
Consolidation at Resistance
In an up-trend we are likely to encounter consolidation in a narrow range above or below resistance:
In an up-trend we are likely to encounter consolidation in a narrow range above or below resistance:
- Consolidation below resistance indicates that buyers do not have sufficient strength to overcome selling pressure at the resistance level. But instead of being overwhelmed, with a resultant correction, they are buying up all available stock in a narrow band below resistance. Continued accumulation is likely to result in a shortage of available stock - and a consequent rise in price.
- Consolidation above resistance, after a breakout, also signals accumulation - and a subsequent price rise.
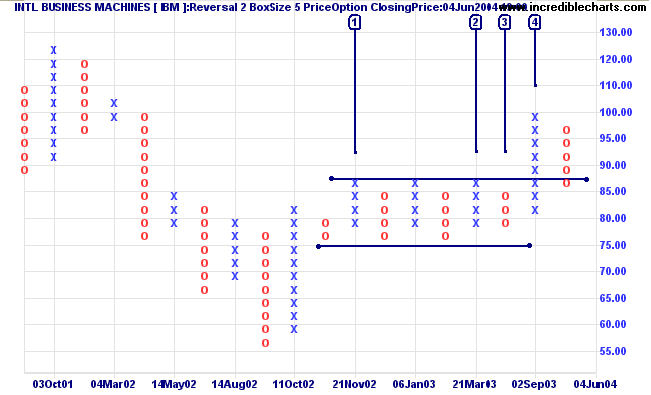
The subsequent pull-back has penetrated IBM's new support level.
A reversal above 80.00 would still be reasonably bullish:
continuing the sequence of higher lows.
Consolidation at Support
The opposite occurs in a down-trend: consolidation is likely to occur at support levels.
The opposite occurs in a down-trend: consolidation is likely to occur at support levels.
- Consolidation above support indicates that sellers do not have sufficient strength to overcome buying pressure but, instead of being overwhelmed, they continue to sell stock in sufficient quantity to maintain price in a narrow band above support. Continued distribution is likely to result in a shortage of ready buyers (a surplus of stock) - and a consequent price fall.
- Consolidation after a breakout below support, signals that there are insufficient buyers to rally price above the new resistance level and are likely to give way under continued selling pressure.
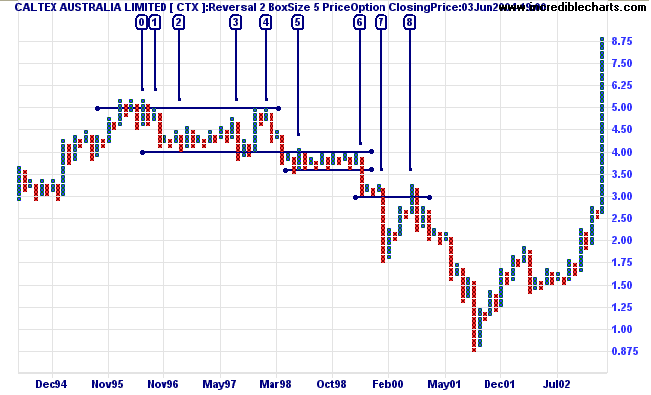
The latest CTX rally is a good example of an upward spike,
explained in
last week's Trading Diary. My preferred strategy is to lock
in profits, with a sell-stop at the reversal point which would
start a new downward column.
Basic point and figure chart patterns are explained at the Trading Guide: P&F Chart Patterns.
Basic point and figure chart patterns are explained at the Trading Guide: P&F Chart Patterns.
About
the Trading Diary has been expanded to offer further
assistance to readers, including directions on how to search the
archives.
Colin Twiggs
In this game, the market has to keep pitching,
but you don't have to swing.
You can stand there with the bat on your shoulder for six months until you get a fat pitch.
~ Warren Buffett
You can stand there with the bat on your shoulder for six months until you get a fat pitch.
~ Warren Buffett
Back Issues
Click here to access the Trading Diary Archives.
Click here to access the Trading Diary Archives.
Back Issues
Access the Trading Diary Archives.