Trading Diary
July 9, 2003
These extracts from my daily trading diary are
intended to illustrate the techniques used in short-term trading
and should not be interpreted as investment advice. Full terms
and conditions can be found at Terms
of Use .
USA
The Dow retreated 0.73% to close at 9156 on higher volume.
The intermediate trend is up.
The primary trend is up.
The Dow retreated 0.73% to close at 9156 on higher volume.
The intermediate trend is up.
The primary trend is up.
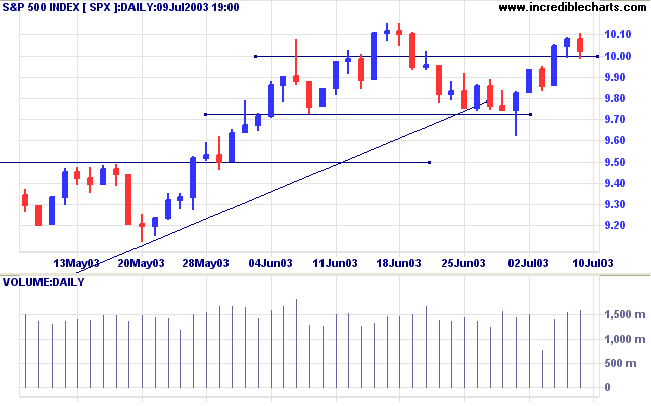
The S&P 500 closed 5 points lower at 1002.
The intermediate trend is up.
The primary trend is up.
The intermediate trend is up.
The primary trend is up.
The Nasdaq Composite closed 1 point up at 1747.
The intermediate trend is up.
The primary trend is up.
The intermediate trend is up.
The primary trend is up.
The Chartcraft NYSE Bullish % Indicator rose
0.73% to 76.00% on July 8.
Market Strategy
Short-term: Increase long positions if the S&P 500 is above
1010.
Intermediate: Increase long positions if the S&P is above 1010.
Long-term: Increase long positions.
Intermediate: Increase long positions if the S&P is above 1010.
Long-term: Increase long positions.
Yahoo
Yahoo stock fell more than 6.0% in after-hours trading, despite announcing positive results. (more)
Yahoo stock fell more than 6.0% in after-hours trading, despite announcing positive results. (more)
Is Japan on the rebound?
The Nikkei has rallied 31% since April. (more)
The Nikkei has rallied 31% since April. (more)
Gold
New York (18.25): Spot gold appears to have stabilized at $US 344.50.
On the five-year chart gold is above the long-term upward trendline.
New York (18.25): Spot gold appears to have stabilized at $US 344.50.
On the five-year chart gold is above the long-term upward trendline.
ASX Australia
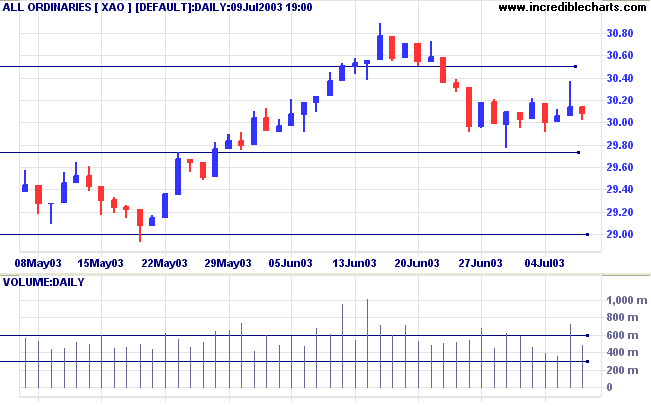
The All Ordinaries shows uncertainty, with the index closing 6
points down at 3008 on lower volume.
The intermediate trend is up.
The primary trend is up.
MACD (26,12,9) is below its signal line; Slow Stochastic (20,3,3) has turned up; Twiggs Money Flow (21) signals accumulation.
The intermediate trend is up.
The primary trend is up.
MACD (26,12,9) is below its signal line; Slow Stochastic (20,3,3) has turned up; Twiggs Money Flow (21) signals accumulation.
Market Strategy
Short-term: Long if the All Ords is above 3022.
Intermediate: The primary trend is up; Long if the All Ords is above 3022.
Long-term: Long.
Intermediate: The primary trend is up; Long if the All Ords is above 3022.
Long-term: Long.
Oil & Gas Exploration
Last covered on July 1, 2003.
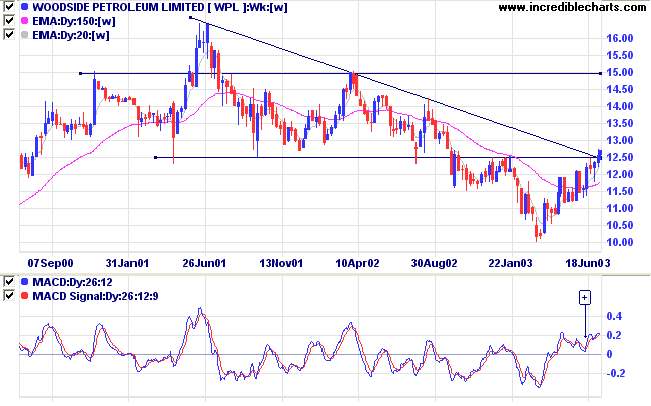
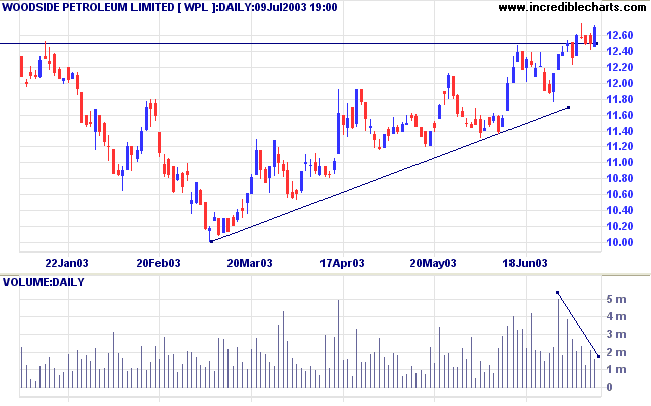
Woodside [WPL] and Santos [STO] have both made new 3-month highs.
Woodside has broken above resistance at 12.50 as well as the long-term downward trendline.
Relative Strength (price ratio: xao) is rising, having made a 3-month high.
Twiggs Money Flow (100-day) is rising but still below zero.
MACD has completed a bullish trough above zero.
Last covered on July 1, 2003.
Woodside [WPL] and Santos [STO] have both made new 3-month highs.
Woodside has broken above resistance at 12.50 as well as the long-term downward trendline.
Relative Strength (price ratio: xao) is rising, having made a 3-month high.
Twiggs Money Flow (100-day) is rising but still below zero.
MACD has completed a bullish trough above zero.
Santos has completed an unusual reversal pattern: a lower high at
[b], followed by a lower trough at [c], and then a correction
back above [b].
Heavy volume is clearly visible in the weeks following the low at [c].
Relative Strength (price ratio: xao) is rising but has yet to make a new 3-month high.
Twiggs Money Flow (100-day) and MACD are both bullish.
Heavy volume is clearly visible in the weeks following the low at [c].
Relative Strength (price ratio: xao) is rising but has yet to make a new 3-month high.
Twiggs Money Flow (100-day) and MACD are both bullish.
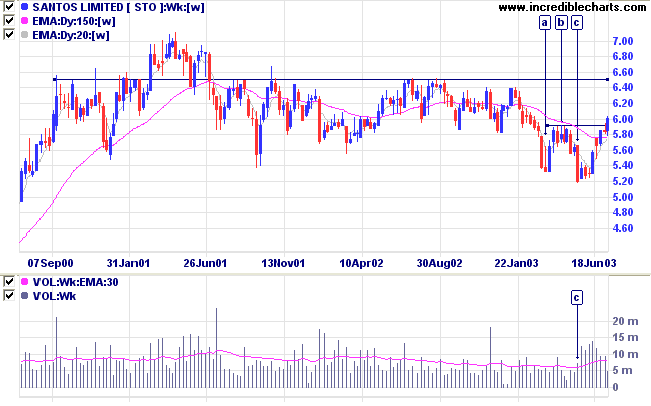
Neither stock exhibits strong volume at the actual breakout and
we can expect a pull-back to re-test the new support levels in
the weeks ahead.
Understanding
the Trading Diary has been expanded to offer further
assistance to readers.
Colin Twiggs
Plan for the difficult while it is easy;
Act on the large while it is minute.....
Those who regard many things as easy
will encounter many difficulties.
Therefore, the Sage regards things as difficult,
And as a result, has no difficulty.
~ Lao Tse.
Act on the large while it is minute.....
Those who regard many things as easy
will encounter many difficulties.
Therefore, the Sage regards things as difficult,
And as a result, has no difficulty.
~ Lao Tse.
Stock Screens: New Highs
To screen for stocks making new highs:
(1) Open % Of Price High;
(2) Enter 98 as the Minimum%;
(3) Sort the Return by clicking on the %H heading.
To screen for stocks making new highs:
(1) Open % Of Price High;
(2) Enter 98 as the Minimum%;
(3) Sort the Return by clicking on the %H heading.
Back Issues
You can now view back issues at the Daily Trading Diary Archives.
You can now view back issues at the Daily Trading Diary Archives.
Back Issues
Access the Trading Diary Archives.

Author: Colin Twiggs is a former investment banker with almost 40 years of experience in financial markets. He co-founded Incredible Charts and writes the popular Trading Diary and Patient Investor newsletters.
Using a top-down approach, Colin identifies key macro trends in the global economy before evaluating selected opportunities using a combination of fundamental and technical analysis.
Focusing on interest rates and financial market liquidity as primary drivers of the economic cycle, he warned of the 2008/2009 and 2020 bear markets well ahead of actual events.
He founded PVT Capital (AFSL No. 546090) in May 2023, which offers investment strategy and advice to wholesale clients.