Trading Diary
December 3, 2005
These extracts from my daily trading diary are
for educational purposes and should not be interpreted as
investment advice. Full terms and conditions can be found at
Terms
of Use.
USA
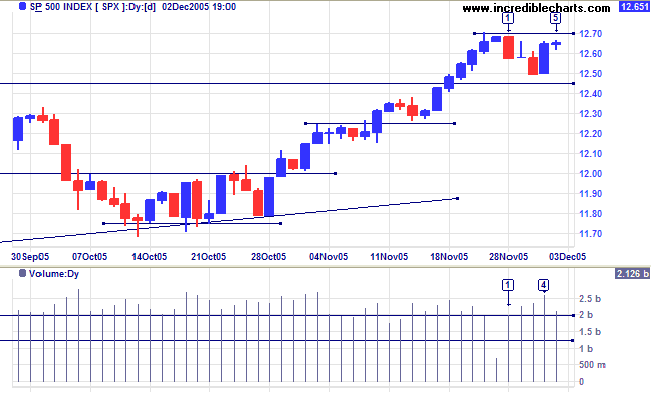
The S&P 500 started the week with a retracement -- strong volume on day [2] and [3] signaling buying support. The short 3 day retracement is a bullish sign, signaling a fast up-trend. Buyers regained control on Thursday [4], with a tall blue candle and even larger volumes. Friday's doji candle [5] indicates short-term consolidation before an attempt to breakout above the 1270 resistance level. Though less likely, a close below support at 1250 would be bearish.
The S&P 500 started the week with a retracement -- strong volume on day [2] and [3] signaling buying support. The short 3 day retracement is a bullish sign, signaling a fast up-trend. Buyers regained control on Thursday [4], with a tall blue candle and even larger volumes. Friday's doji candle [5] indicates short-term consolidation before an attempt to breakout above the 1270 resistance level. Though less likely, a close below support at 1250 would be bearish.
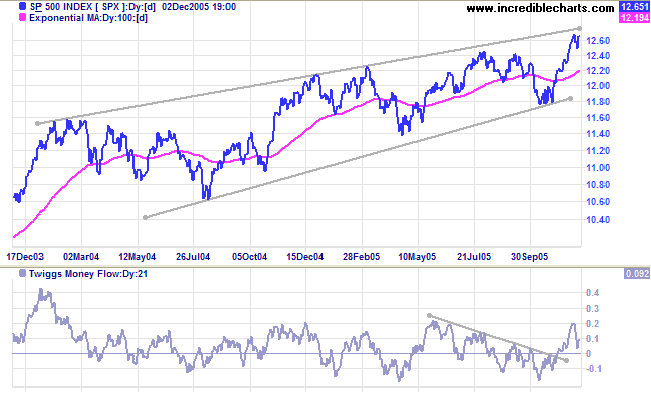
In the long-term the index is testing the upper border of a
bearish
rising wedge pattern. A breakout above the wedge pattern
would signal a stronger up-trend with a target of 1500: 1260 +
(1160 - 800) = 1620. A reversal at the upper border, however,
would mean a further test of the lower edge of the pattern.
Twiggs Money Flow (21-day) signals accumulation with a
reversal above the zero line.
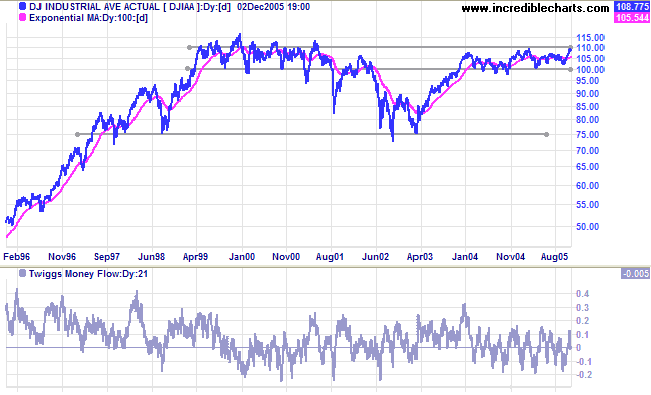
The Dow Industrial Average is headed for another test of
resistance at 11000.
Twiggs Money Flow (21-day) is neutral, having fallen to near
the zero line. In the long-term the Dow faces heavy resistance at
11000/11500 and strong support at 10000.
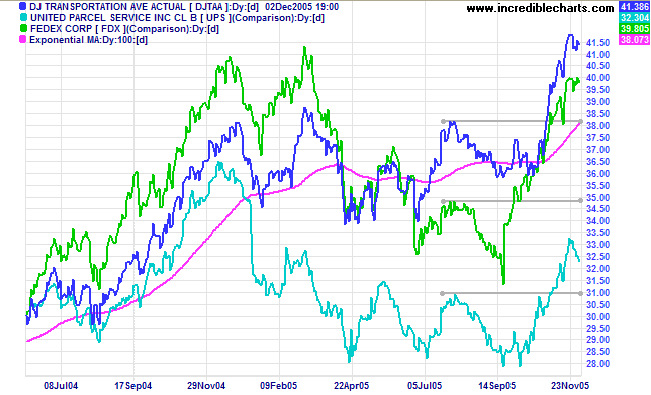
The Dow Jones Transportation Average and its two
stalwarts, Fedex and UPS, have all commenced strong primary
up-trends: a bullish sign for the general equity market.
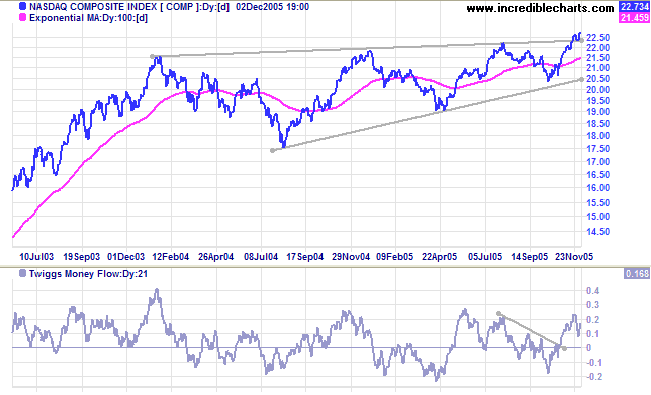
The Nasdaq Composite completed a successful pull-back,
respecting the upper border of the bearish
rising wedge pattern.
Twiggs Money Flow (21-day) signals accumulation, with a
trough above zero. This is another positive sign for the
general equity market.
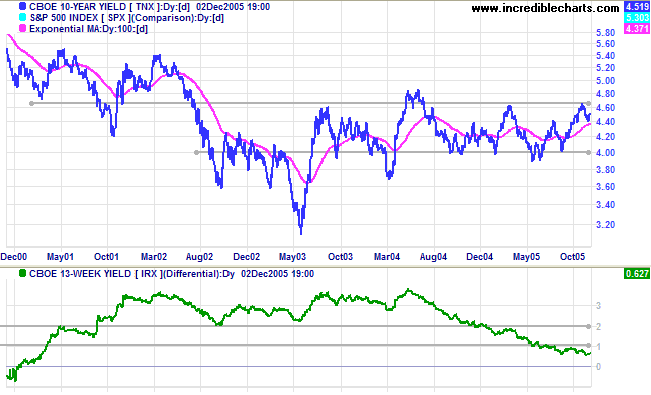
Treasury yields
Long-term yields rallied during the week on positive economic news (and prospects of higher inflation). Another test of resistance would be a positive sign for yields (a negative sign for bond prices). A confirmed breakout above resistance, while still only a possibility at this stage, would ease pressure on the yield curve and have positive medium-term benefits for the economy.
The yield differential (10-year T-notes minus 13-week T-bills) remains low, leaving the Fed a tough choice: continue to hike short-term rates and end up with a negative yield curve, or ease the program of rate hikes and risk having inflation take root. Either result could have negative consequences.
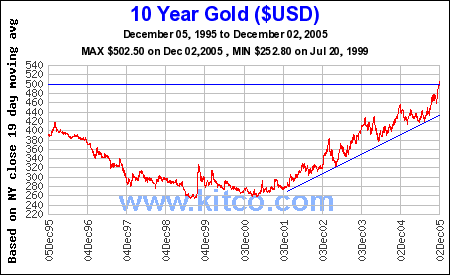
Gold
New York: Spot gold broke through $500 for the first time in 18 years, closing at $502.90 on Friday. Expect a pull-back to test $500, the new support level, in the next few weeks. If successful, the metal is in blue sky territory and we should witness a sustained rally.
New York: Spot gold broke through $500 for the first time in 18 years, closing at $502.90 on Friday. Expect a pull-back to test $500, the new support level, in the next few weeks. If successful, the metal is in blue sky territory and we should witness a sustained rally.
United Kingdom
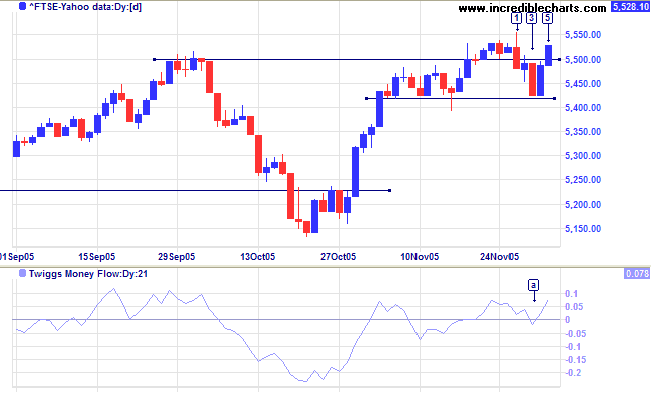
The FTSE 100 failed to respect the new 5500 support level, closing below at [1] followed by another strong red candle at [3]. Buyers regained control at the 5420 support level on Thursday [4] and the index recovered above 5500 on day [5]. The marginal break below support remains a bullish sign, demonstrating buyers' commitment to the market, and we should see a further rally. Twiggs Money Flow (21-day) is bullish, respecting the zero line with the latest trough at [a]. The target for an upward breakout is close to 6000: 5500 + (5500 - 5140) = 5860.
The FTSE 100 failed to respect the new 5500 support level, closing below at [1] followed by another strong red candle at [3]. Buyers regained control at the 5420 support level on Thursday [4] and the index recovered above 5500 on day [5]. The marginal break below support remains a bullish sign, demonstrating buyers' commitment to the market, and we should see a further rally. Twiggs Money Flow (21-day) is bullish, respecting the zero line with the latest trough at [a]. The target for an upward breakout is close to 6000: 5500 + (5500 - 5140) = 5860.
Japan
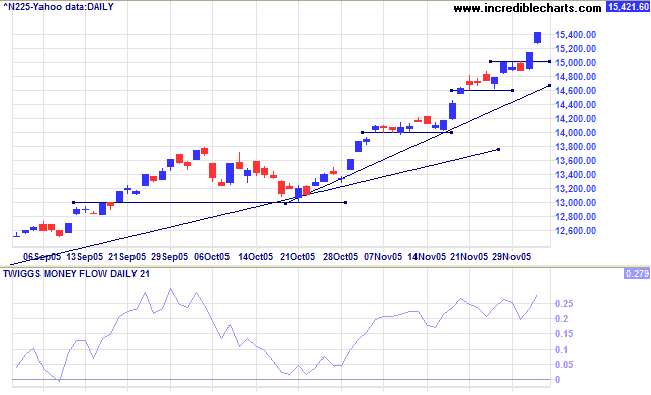
The Nikkei 225 remains exceedingly bullish, breaking through 15000 on Thursday before a continuation gap on Friday. Traders need to bear in mind that the accelerating curve can develop into a blow-off (with consequent sharp correction). Twiggs Money Flow (21-day) is exceptionally strong, forming troughs high above the zero line. Expect the primary up-trend to continue for some time, with a long-term target around 16000: 12000 + ( 12000 - 7600 [April 2003]) = 16400.
The Nikkei 225 remains exceedingly bullish, breaking through 15000 on Thursday before a continuation gap on Friday. Traders need to bear in mind that the accelerating curve can develop into a blow-off (with consequent sharp correction). Twiggs Money Flow (21-day) is exceptionally strong, forming troughs high above the zero line. Expect the primary up-trend to continue for some time, with a long-term target around 16000: 12000 + ( 12000 - 7600 [April 2003]) = 16400.
ASX Australia
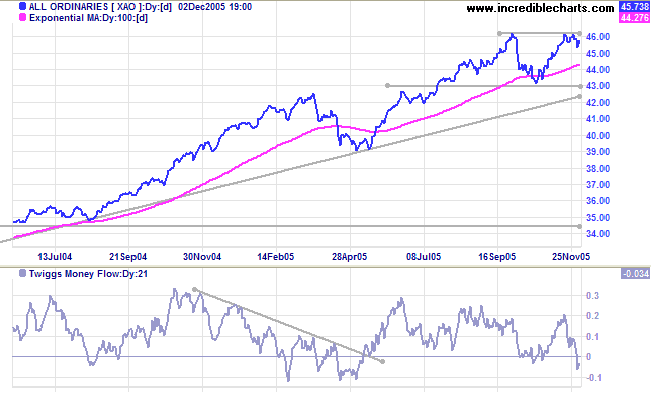
The All Ordinaries fell through support at 4560 at [4]. The huge volume shows that strong buying support was overcome by the weight of selling -- especially after many traders' stops were triggered by the fall below 4560. Friday took many by surprise: after a bullish day in US markets, buyers regained control, carrying the index back above the support level. The weak close at [5], however, leaves a question-mark as to whether this latest resurgence is sustainable. If the rally fades below 4620, failing to test the resistance level, that would be a bearish sign; as would a close back below 4560. Otherwise, the consolidation is likely to resolve in an upward breakout.
The All Ordinaries fell through support at 4560 at [4]. The huge volume shows that strong buying support was overcome by the weight of selling -- especially after many traders' stops were triggered by the fall below 4560. Friday took many by surprise: after a bullish day in US markets, buyers regained control, carrying the index back above the support level. The weak close at [5], however, leaves a question-mark as to whether this latest resurgence is sustainable. If the rally fades below 4620, failing to test the resistance level, that would be a bearish sign; as would a close back below 4560. Otherwise, the consolidation is likely to resolve in an upward breakout.
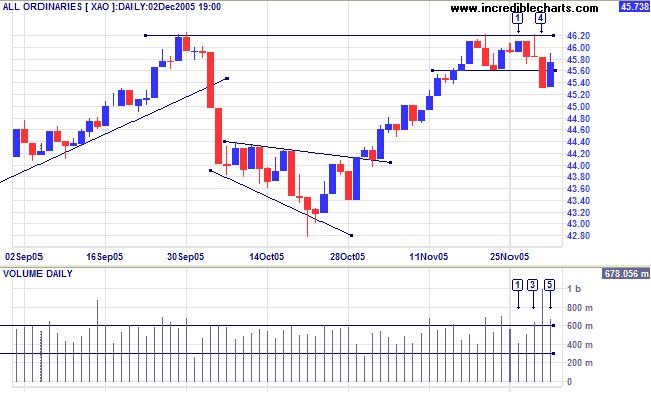
Twiggs Money Flow (21-day) dipped below zero to signal
distribution. The index remains in a strong primary up-trend and
a breakout above 4620 would present a target close to 5000: 4620
+ (4620 - 4320) = 4920. On the other hand, failure to break above
resistance would signal a test of primary support at 4300.
For further assistance, read About
the Trading Diary.
Colin Twiggs
There is no failure except in no longer
trying.
~ Elbert Hubbard.
~ Elbert Hubbard.

Author: Colin Twiggs is a former investment banker with almost 40 years of experience in financial markets. He co-founded Incredible Charts and writes the popular Trading Diary and Patient Investor newsletters.
Using a top-down approach, Colin identifies key macro trends in the global economy before evaluating selected opportunities using a combination of fundamental and technical analysis.
Focusing on interest rates and financial market liquidity as primary drivers of the economic cycle, he warned of the 2008/2009 and 2020 bear markets well ahead of actual events.
He founded PVT Capital (AFSL No. 546090) in May 2023, which offers investment strategy and advice to wholesale clients.