|
Trading Plans Here is an excerpt from a Chart Forum post I made that bears repeating: Rule #1 for me is that the trading plan should be concise enough to carry in your head, without referring back to the written version........... The Trading plan is a summary of what, when, how and how much: stock selection, entries, exits, and risk management. I believe that there is an inverse relationship: the more you put in, the less you get out. Colin . |
Trading Diary
September 4, 2003
These extracts from my daily trading diary
are for educational purposes
and should not be interpreted as investment
advice. Full terms and conditions can be found at Terms
of Use .
USA
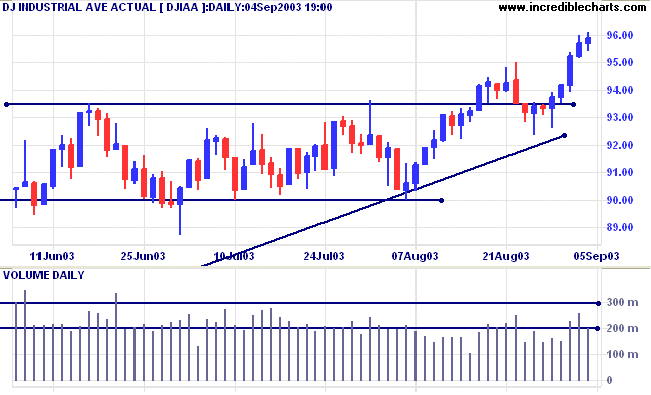
The Dow Industrial Average gained a further 0.2%
to close at 9588. Lower volume signals that buying pressure is
easing.
The intermediate trend is up.
The primary trend is up.
Twiggs Money Flow and MACD are both bullish.
The intermediate trend is up.
The primary trend is up.
Twiggs Money Flow and MACD are both bullish.
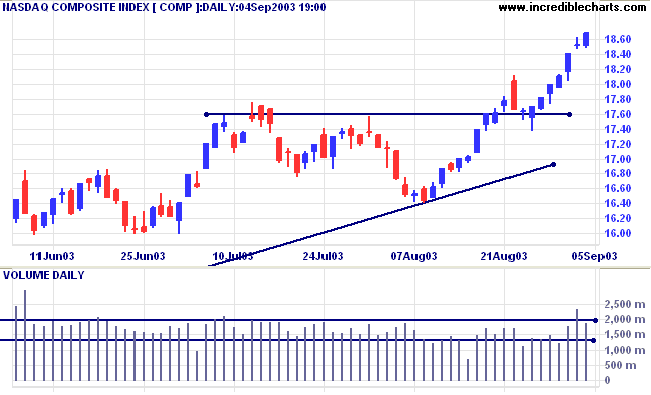
The Nasdaq Composite rallied 16 points to close
at 1869 on reasonable volume.
The intermediate trend is up.
The primary trend is up.
Twiggs Money Flow and MACD are both bullish.
The intermediate trend is up.
The primary trend is up.
Twiggs Money Flow and MACD are both bullish.
The S&P 500 gained a further 2 points to
close at 1028 on reasonable volume.
The intermediate trend is up.
The primary trend is up.
The intermediate trend is up.
The primary trend is up.
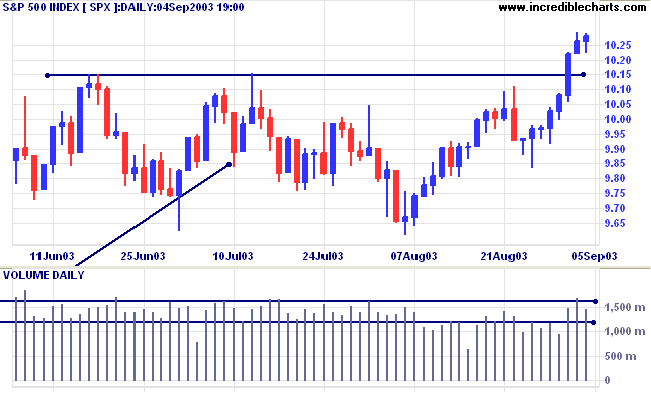
The Chartcraft NYSE Bullish % Indicator is at
78.98% (September 3).
Market Strategy
Short-term: Long above 1022.
Intermediate: Long if the index is above 1015.
Long-term: Long if the index is above 960.
Short-term: Long above 1022.
Intermediate: Long if the index is above 1015.
Long-term: Long if the index is above 960.
Low interest rates to stay
Federal reserve governor Ben Bernanke says that the economy still has a lot of slack and the Fed will keep rates low through much of 2004 and may even make further cuts. (more)
Federal reserve governor Ben Bernanke says that the economy still has a lot of slack and the Fed will keep rates low through much of 2004 and may even make further cuts. (more)
Treasury yields
After the Fed Governor's announcement, the 10-year treasury note yield eased slightly to 4.51%.
The intermediate trend is up, with the yield forming a bullish consolidation above support at 4.25%.
The primary trend is up.
After the Fed Governor's announcement, the 10-year treasury note yield eased slightly to 4.51%.
The intermediate trend is up, with the yield forming a bullish consolidation above support at 4.25%.
The primary trend is up.
Gold
New York (19.51): Spot gold is at $373.30 after testing 370.
The primary trend is up.
Price has broken above a symmetrical triangle, with a target of 420. There is still some resistance at 382.
New York (19.51): Spot gold is at $373.30 after testing 370.
The primary trend is up.
Price has broken above a symmetrical triangle, with a target of 420. There is still some resistance at 382.
ASX Australia
The All Ordinaries rallied to close up 15 points at 3234 on
strong volume. Short corrections and heavy volume signal an
accelerating trend.
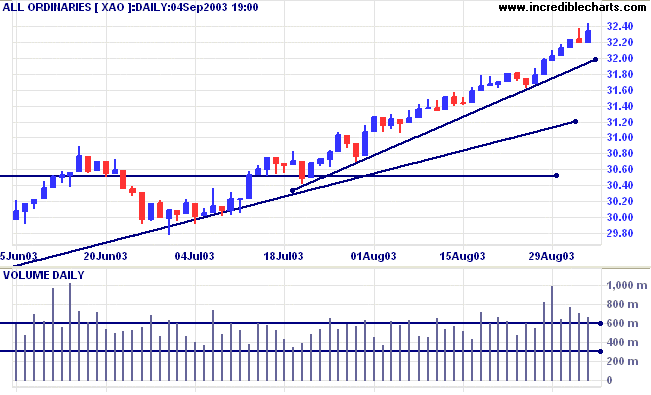
The intermediate trend and primary trend are both up.
MACD (26,12,9) is above its signal line; Slow Stochastic (20,3,3) is below;
Twiggs Money Flow signals accumulation.
MACD (26,12,9) is above its signal line; Slow Stochastic (20,3,3) is below;
Twiggs Money Flow signals accumulation.
Market Strategy
Short-term: Long if the XAO is above 3219.
Intermediate: Long if the index is above 3162.
Long-term: Long if the index is above 2978 .
Short-term: Long if the XAO is above 3219.
Intermediate: Long if the index is above 3162.
Long-term: Long if the index is above 2978 .
Utilities sector
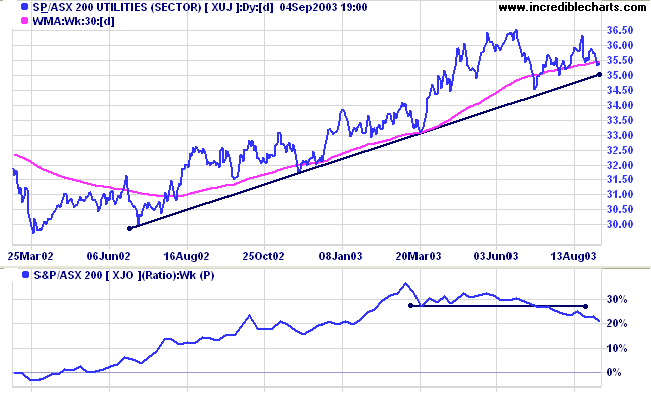
The Utilities index [XUJ] is in a stage 2 up-trend, but Relative Strength has fallen to a 6-month low.
The Utilities index [XUJ] is in a stage 2 up-trend, but Relative Strength has fallen to a 6-month low.
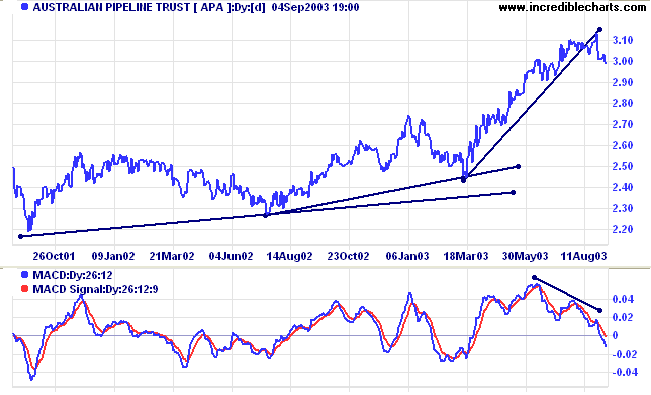
Australian Pipeline Trust [APA] is losing momentum, breaking
below its trendline after a strong rally. Relative Strength is
falling, while Twiggs Money Flow (100) and MACD display bearish
divergences.
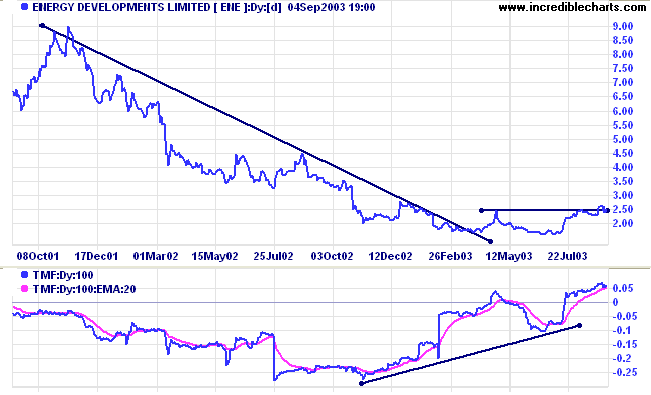
Energy Developments [ENE] has entered a stage 1 base after a
lengthy down-trend. Relative Strength is rising but has yet to
make a 3-month high, while Twiggs Money Flow (100) and MACD show
bullish divergences.
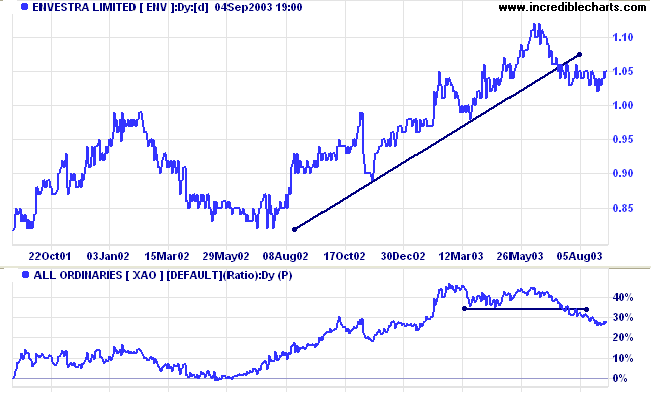
Envestra [ENV] has broken its upward trendline. Relative Strength
has fallen to a 6-month low, while Twiggs Money Flow (100) and
MACD are declining.
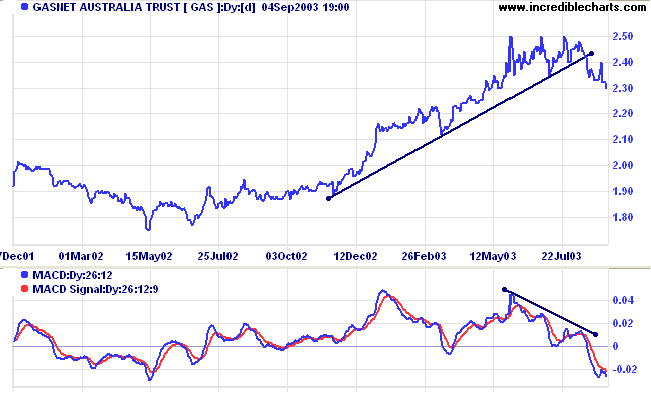
Gasnet [GAS] has broken its upward trendline. Relative Strength
is falling. Twiggs Money Flow (100) and MACD show bullish
divergences.
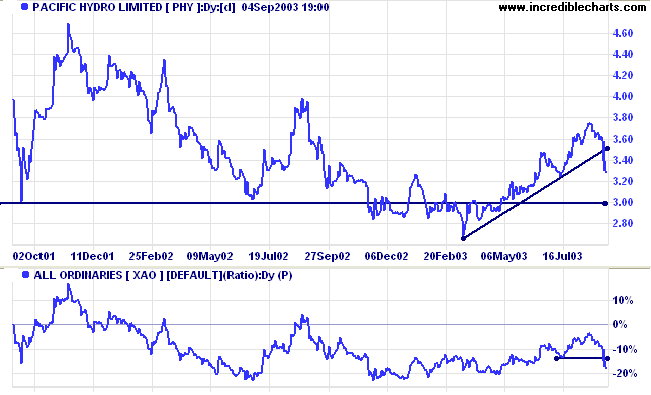
Pacific Hydro [PHY] has also broken its trendline but has yet to
signal a reversal. Relative Strength fell sharply, Twiggs Money
Flow (100) is neutral while MACD is bearish.
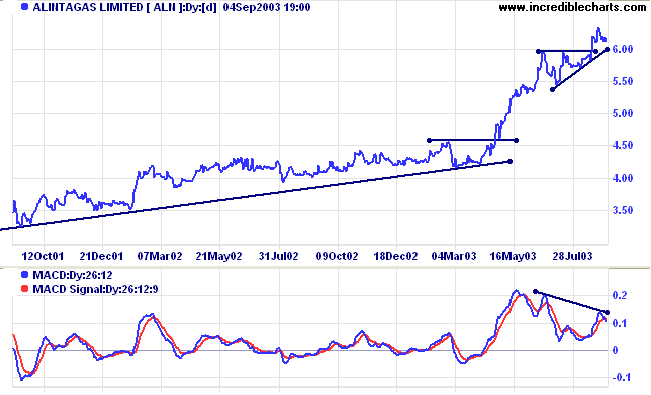
Alinta Gas [ALN] completed an ascending triangle, shortly after
the UEL takeover in July, signaling continuation of the up-trend.
Relative Strength is rising and Twiggs Money Flow (100) is
bullish but MACD shows a bearish divergence.
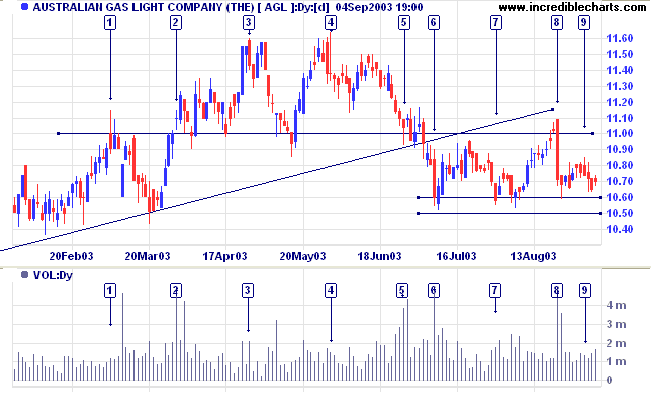
Australian Gas Light [AGL] has broken below its upward trendline
and is consolidating below the 11.00 resistance level, from the
lows of the double top. Relative Strength is falling, while
Twiggs Money Flow (100) and MACD are bearish.
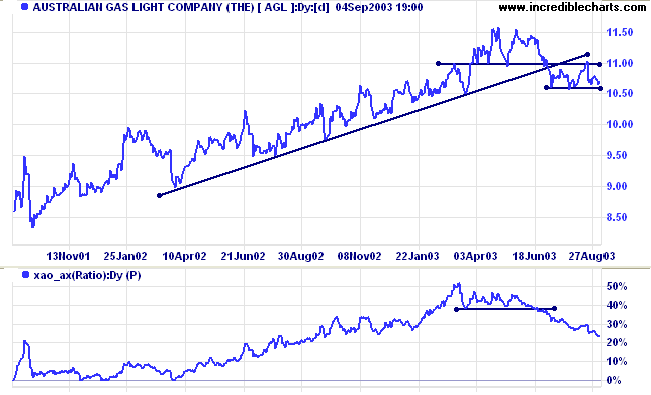
On the daily volume chart AGL can be seen to form equal highs in
an up-trend, at [3] and [4]. This is not particularly bearish,
but the correction back to [5] was accompanied by strong volume
and the double top reversal was completed with a further downward
break at [6]. This is an intermediate pattern and the target is
only 10.20 (10.90 - (11.60 - 10.90)).
The stock is now at a key point: support has formed at 10.60/10.50 with equal lows at [6] and [7] but strong resistance has formed at 11.00, with a false break at [8] followed by a sharp pull-back on heavy volume. We now see consolidation at [9], near to the support level, a bear signal.
A fall below 10.50 (or close below 10.60) would be a strong bear signal, while a break above 11.00 would be bullish.
Understanding
the Trading Diary has been expanded to offer further
assistance to readers.
Colin Twiggs
An expert is a person who avoids the small
errors
while sweeping on to the grand fallacy.
~ Unknown
while sweeping on to the grand fallacy.
~ Unknown
Backing up Project and Watchlist
files
| Use the File >> Export Files command to regularly copy your watchlist (.viz) and project (.ini) files to a removable disk. See Backup for further details. |
Back Issues
You can now view back issues at the Daily Trading Diary Archives.
You can now view back issues at the Daily Trading Diary Archives.
Back Issues
Access the Trading Diary Archives.

Author: Colin Twiggs is a former investment banker with almost 40 years of experience in financial markets. He co-founded Incredible Charts and writes the popular Trading Diary and Patient Investor newsletters.
Using a top-down approach, Colin identifies key macro trends in the global economy before evaluating selected opportunities using a combination of fundamental and technical analysis.
Focusing on interest rates and financial market liquidity as primary drivers of the economic cycle, he warned of the 2008/2009 and 2020 bear markets well ahead of actual events.
He founded PVT Capital (AFSL No. 546090) in May 2023, which offers investment strategy and advice to wholesale clients.