2003 Membership
The free trial period will run for at least 4
weeks from when the new data is introduced.
Subscription/Registration forms will be available from the start of the free trial period.
We will keep you informed of progress.
Subscription/Registration forms will be available from the start of the free trial period.
We will keep you informed of progress.
Trading Diary
January 14, 2003
These extracts from my daily trading diary are
intended to illustrate the techniques used in short-term trading
and should not be interpreted as investment advice. Full terms
and conditions can be found at Terms
of Use .
USA
The Dow closed up 0.6% at 8842, forming an
inside day on average volume.
The average is ranging between 8161 and 9076, at the top end of the base that has been forming since July 2002; a bullish sign.
The primary trend is down and will only reverse up if the average rises above 9076 (the high from December 02).
The Nasdaq Composite formed an inside day, closing up 1% at 1461.
The primary trend is up.
The S&P 500 closed up 0.6% at 931.
The index ranges between 965 and 768, establishing a base. It has recently held above 867 and failed to re-test support at 768; a bullish sign.
The Chartcraft NYSE Bullish % Indicator increased to 52% (January 13).
Intel
The chip maker made after-hours gains after announcing fourth-quarter earnings of 16 cents per share, compared to expectations of 14 cents. (more)
Gold
New York: Spot gold lost 320 cents to $US 350.90
The chip maker made after-hours gains after announcing fourth-quarter earnings of 16 cents per share, compared to expectations of 14 cents. (more)
Gold
New York: Spot gold lost 320 cents to $US 350.90
ASX Australia
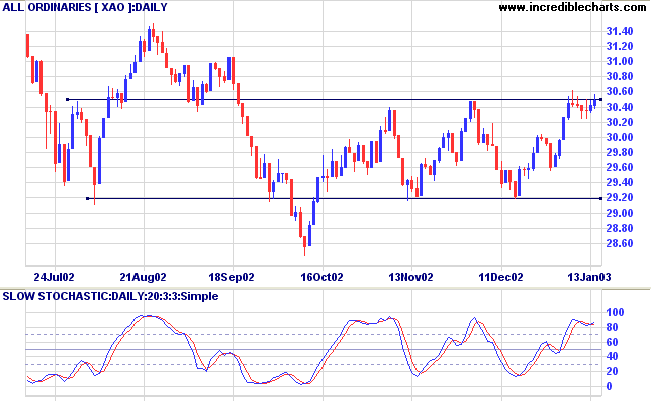
The All Ordinaries again tested resistance at 3050 and, again,
failed to close above 3050. The index closed at 3049 on average
volume.
The index ranges between 2915 and 3050, forming a base. A break above 3050 will signal a primary trend change to an up-trend. Look for volume confirmation.
Slow Stochastic (20,3,3) has crossed to above its signal line; MACD (26,12,9) is above; Twiggs money flow signals accumulation.
The index ranges between 2915 and 3050, forming a base. A break above 3050 will signal a primary trend change to an up-trend. Look for volume confirmation.
Slow Stochastic (20,3,3) has crossed to above its signal line; MACD (26,12,9) is above; Twiggs money flow signals accumulation.
Macquarie Bank [MBL]
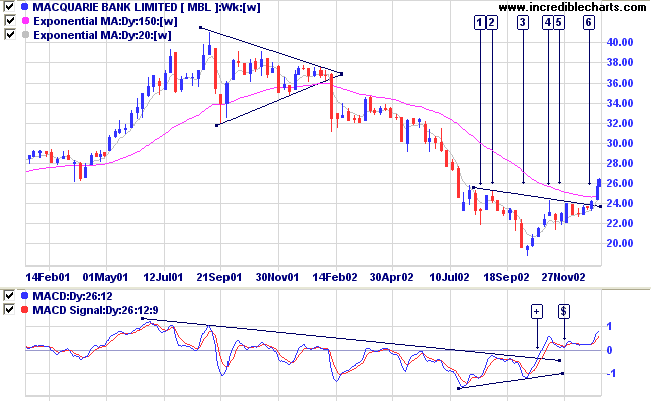
MBL formed a stage 3 top in the form of a triangle, followed by a stage 4 down-trend for the next 12 months. The stock has recently completed an inverted head and shoulders reversal pattern, from [1] to [6].
Relative strength (price ratio: xao) is rising and Twiggs money flow signals accumulation. MACD broke its downward trendline at [+] after completing a bullish divergence. The subsequent trough did not cross below zero [$], a further bullish signal.
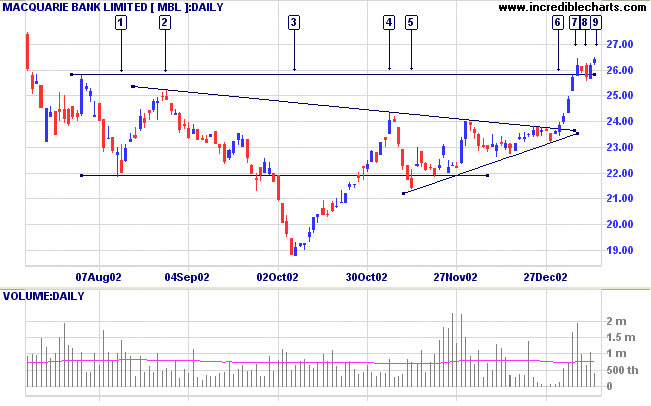
The daily chart shows the reversal pattern in greater detail.
The inverted head and shoulders pattern started with a shoulder
at [1] followed by the head at [3]. The right shoulder at [5]
is followed by a surge in volume but failed to immediately
break above the neckline. Instead MBL proceeded to form a
symmetrical triangle, with 3 peaks before the breakout at 6.
Note how volume dried up on the last trough before the
breakout, albeit over the festive season.
Entry points were:
-
On the breakout from the inverted
head-and-shoulders/triangle at [6], with a stop below the
recent low, 2 days earlier.
Some traders may have chosen to enter a day earlier, spurred by the dry-up in volume and the short duration of the counter-trend. - The rally to $26 was accompanied by a reassuring surge in volume. The subsequent congestion from [7] to [9] showed a dry-up of volume and the counter-trend at [8] was of very short duration. Entry can be taken at [9] with a stop below the low of [8]. A break back below the low would be a bearish sign.
Market strategy
For further guidance see Understanding the Trading Diary.
For further guidance see Understanding the Trading Diary.
Short-term: Long if the All Ords rises above 3060. The Slow
Stochastic and MACD are above their respective signal lines.
Medium-term: Avoid new entries.
Long-term: Wait for confirmation of the
bottom reversal signal.
Colin Twiggs
Courage is not the absence of fear;
rather it is the ability to take action in the face of fear.
- Nancy Anderson: Work With Passion
rather it is the ability to take action in the face of fear.
- Nancy Anderson: Work With Passion
Back Issues
Click here to access the
Trading Diary Archives.
Back Issues
Access the Trading Diary Archives.

Author: Colin Twiggs is a former investment banker with almost 40 years of experience in financial markets. He co-founded Incredible Charts and writes the popular Trading Diary and Patient Investor newsletters.
Using a top-down approach, Colin identifies key macro trends in the global economy before evaluating selected opportunities using a combination of fundamental and technical analysis.
Focusing on interest rates and financial market liquidity as primary drivers of the economic cycle, he warned of the 2008/2009 and 2020 bear markets well ahead of actual events.
He founded PVT Capital (AFSL No. 546090) in May 2023, which offers investment strategy and advice to wholesale clients.