Gold breakout above $2,500 per ounce
Gold broke to a new high above $2,500 per ounce, boosted by growing expectations of a September Fed rate cut. Long-term Treasury yields fell, and the Dollar weakened. Stocks lifted, but there are concerning signs of tighter liquidity in financial markets.
Low crude oil, base metals, and iron ore prices also reflect weak industrial demand from China, which threatens to slow global growth over the next decade.
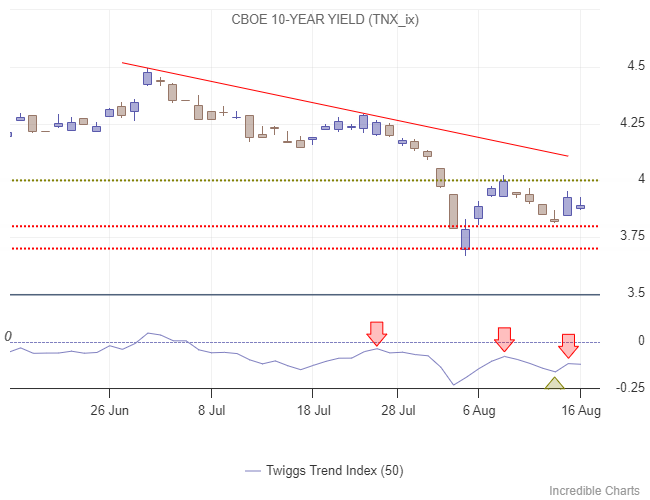
Treasury Markets
Ten-year Treasury yields retreated to 3.9% as expectations solidify for a Fed rate cut at the September 17-18 FOMC meeting. Another Trend Index peak below zero warns of long-term selling pressure.
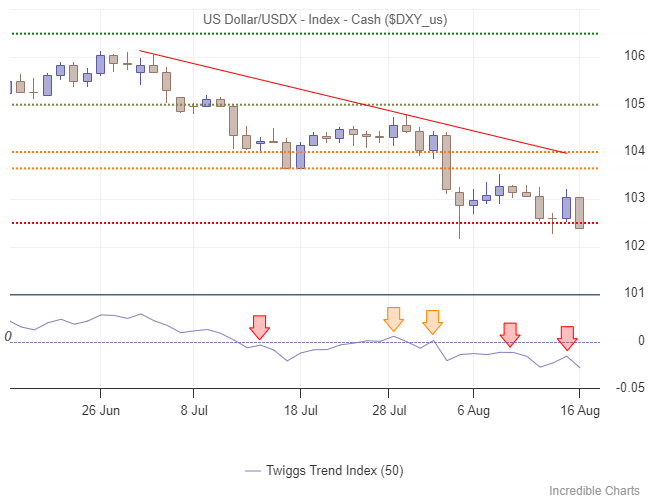
Dollar & Gold
The Dollar Index broke support at 102.50 while the Trend Index again peaked below zero, continuing to warn of long-term selling pressure.
Gold broke resistance at $2,475 per ounce, offering a target of $2,600. Expect retracement to test the new support level, but rising Trend Index troughs above zero signal long-term buying pressure. Respect of support is likely to confirm a fresh advance.

Silver also rallied, testing resistance at $29 per ounce. Breakout would signal that the downtrend has likely ended.
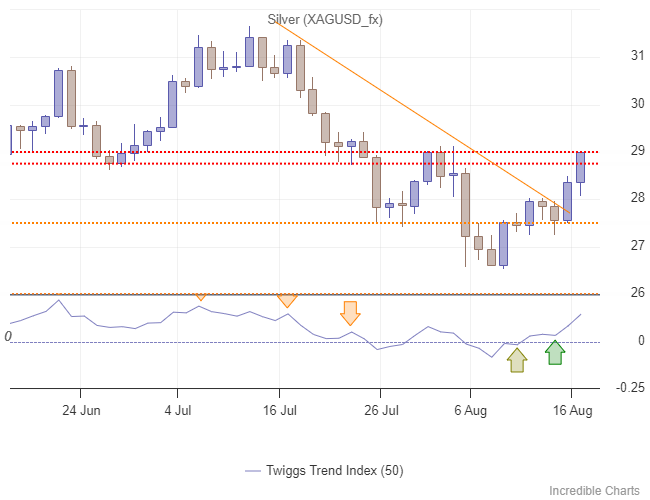
We expect gold to outperform silver because of weak industrial demand from China.
Stocks
The S&P 500 edged higher but failed to show the same enthusiasm as with precious metals.
To continue reading - try it for a Dollar
Access to the Patient Investor requires a subscription. Try our special offer of $1 for the first month.
Subscribers enjoy full access to a comprehensive discussion of each risk measure and regular market risk updates.
Market Analysis Subscribers
Everything contained in this email, related websites, training videos and training courses (collectively referred to as the "Material") has been written for the purpose of teaching analysis, trading and investment techniques. The Material neither purports to be, nor is it intended to be, advice to trade or to invest in any financial instrument, or class of financial instruments, or to use any particular methods of trading or investing.
Advice in the Material is provided for the general information of readers and viewers (collectively referred to as "Readers") and does not have regard to any particular person's investment objectives, financial situation or needs. Accordingly, no Reader should act on the basis of any information in the Material without properly considering its applicability to their financial circumstances. If not properly qualified to do this for themselves, Readers should seek professional advice.
Investing and trading involves risk of loss. Past results are not necessarily indicative of future results.
You, the Reader, need to conduct your own research and decide whether to invest or trade. The decision is yours alone. We expressly disavow all and any liability to any person, with respect of anything, and of the consequences of anything, done or omitted to be done by any such person in reliance upon the whole or any part of the Material.

Author: Colin Twiggs is a former investment banker with almost 40 years of experience in financial markets. He co-founded Incredible Charts and writes the popular Trading Diary and Patient Investor newsletters.
Using a top-down approach, Colin identifies key macro trends in the global economy before evaluating selected opportunities using a combination of fundamental and technical analysis.
Focusing on interest rates and financial market liquidity as primary drivers of the economic cycle, he warned of the 2008/2009 and 2020 bear markets well ahead of actual events.
He founded PVT Capital (AFSL No. 546090) in May 2023, which offers investment strategy and advice to wholesale clients.