What's New: New Stock Screen Filters
We have rebuilt our stock screener module, enabling some long outstanding additions and improvements to the stock screen filters:
- Commodity Channel Index
- Above/Below Zero
- Crossover
- Donchian Channels
- New High/Low
- Previous High/Low
- Mid-Line Crossover
- MACD
- MACD Histogram Reversals
- MACD Histogram Above/Below Zero
- RSI (Relative Strength Index)
- Value Filter
- Crossover New
- Slow Stochastic
- Crossover New
- Twiggs Trend Index
- Crossover
Further improvements are planned.
We are constrained by the number of filters we can add but please send us feedback or suggestions.
New filters:
Commodity Channel Index
Commodity Channel Index signals when a trend is strengthening or weakening.
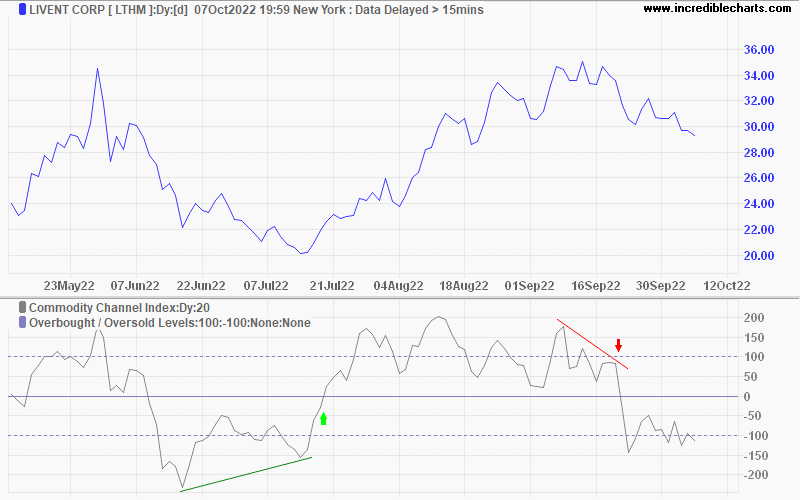
Above/Below Zero (Crossover)
Crossover of zero identifies trend changes.
Crossover
Crossover of 100 or -100 offer further confirmation.
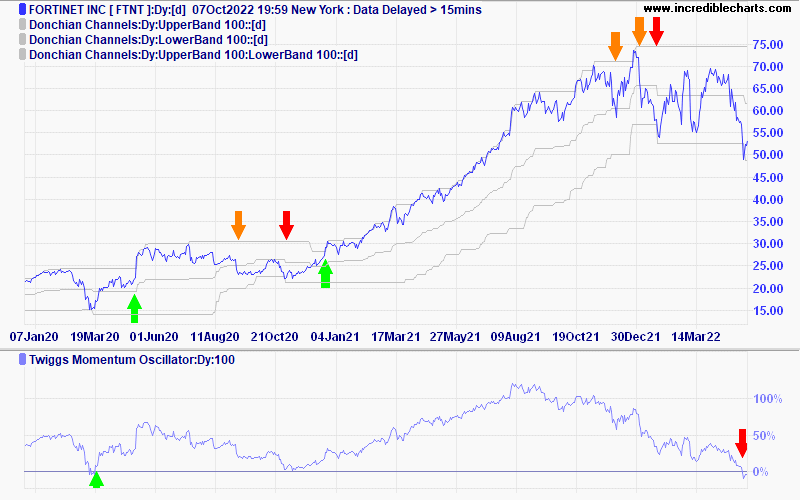
Donchian Channels
Donchian Channels track long-term highs and lows, calculated using either highs & lows or closing price.
New Highs/Lows
Identifies when a new high or low is reached (i.e. when the upper band rises or the lower band falls).
Previous Highs/Lows
Identifies the previous change in the above filter. A recent change suggests a strong trend, while an older previous high/low would indicate the start of a new trend.
Mid-line Crossovers
Mid-line crossovers can be used for a long-term trend following, in a similar fashion to a moving average.
MACD & Histogram
MACD Histogram identifies convergence between the MACD and its signal line.
MACD (green) above its signal line (red) indicates an up-trend. Divergence on the MACD Histogram offers early warning of a trend change.
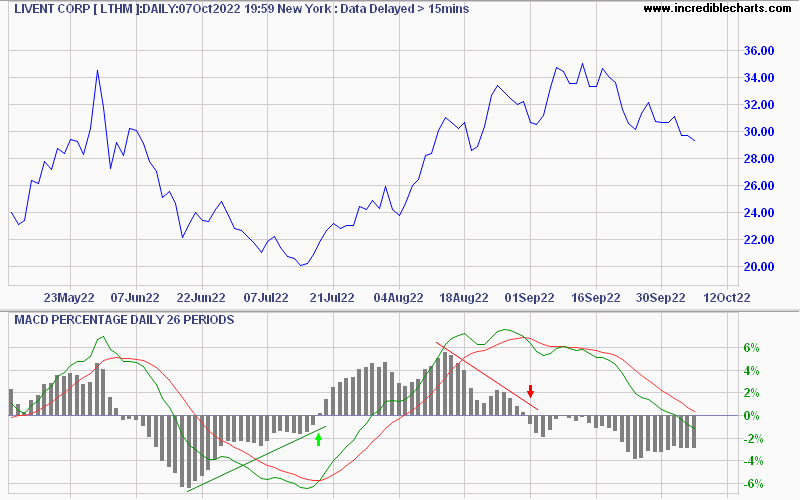
MACD Histogram Reversals
Reversals highlight when the MACD Histogram has changed direction. Scan for reversals — by 1, 2 or 3 percent — calculated using MACD Percentage.
MACD Histogram Above/Below Zero Crossover
Crossover of zero is the same as MACD crossover of its signal line. Please use the MACD Crossover filter.
RSI (Relative Strength Index)
We have expanded and refined the available RSI filters.
Value Filter
Identify Minimum or Maximum values.
Crossover New
Identify crossovers above/below the 20, 30, 50, 70 or 80 levels.
Slow Stochastic
We made a similar improvement to Slow Stochastic, see RSI Crossover New.
Twiggs Trend Index
Crossover of zero identifies trending stocks.
The longer the time period above zero, the stronger the accumulation by buyers.
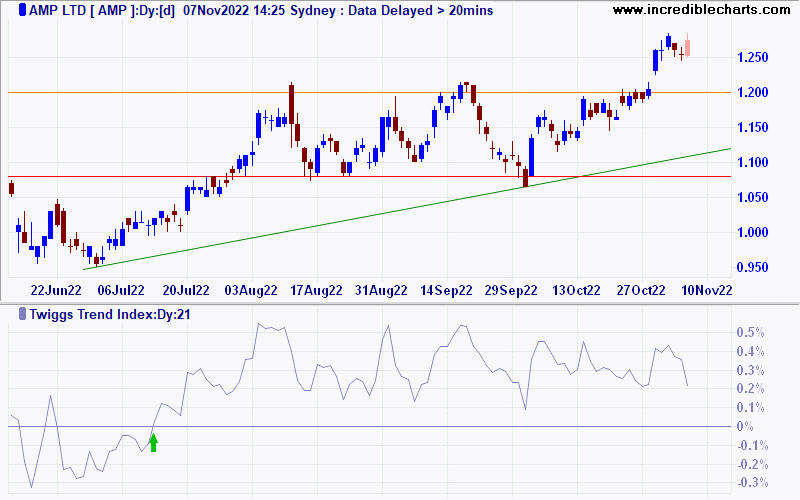
Similarly, the longer the Trend Index remains below zero, the stronger the distribution by sellers.
We hope that you find the new filters useful. Please send us your feedback or suggestions.
Colin Twiggs is director of The Patient Investor Pty Ltd, an Authorised Representative (no. 1256439) of MoneySherpa Pty Limited which holds Australian Financial Services Licence No. 451289.
Everything contained in this web site, related newsletters, training videos and training courses (collectively referred to as the "Material") has been written for the purpose of teaching analysis, trading and investment techniques. The Material neither purports to be, nor is it intended to be, advice to trade or to invest in any financial instrument, or class of financial instruments, or to use any particular methods of trading or investing.
Advice in the Material is provided for the general information of readers and viewers (collectively referred to as "Readers") and does not have regard to any particular person's investment objectives, financial situation or needs. Accordingly, no Reader should act on the basis of any information in the Material without properly considering its applicability to their financial circumstances. If not properly qualified to do this for themselves, Readers should seek professional advice.
Investing and trading involves risk of loss. Past results are not necessarily indicative of future results.
You, the Reader, need to conduct your own research and decide whether to invest or trade. The decision is yours alone. We expressly disavow all and any liability to any person, with respect of anything, and of the consequences of anything, done or omitted to be done by any such person in reliance upon the whole or any part of the Material.
Read the Financial Services Guide.

Author: Colin Twiggs is a former investment banker with almost 40 years of experience in financial markets. He co-founded Incredible Charts and writes the popular Trading Diary and Patient Investor newsletters.
Using a top-down approach, Colin identifies key macro trends in the global economy before evaluating selected opportunities using a combination of fundamental and technical analysis.
Focusing on interest rates and financial market liquidity as primary drivers of the economic cycle, he warned of the 2008/2009 and 2020 bear markets well ahead of actual events.
He founded PVT Capital (AFSL No. 546090) in May 2023, which offers investment strategy and advice to wholesale clients.